Other default OS Dashboards? @Tribe29
Is it planed to create the same Dashboards (and “sub dashboards” = idividual hosts) for the other environments your’re shipping out Agents?
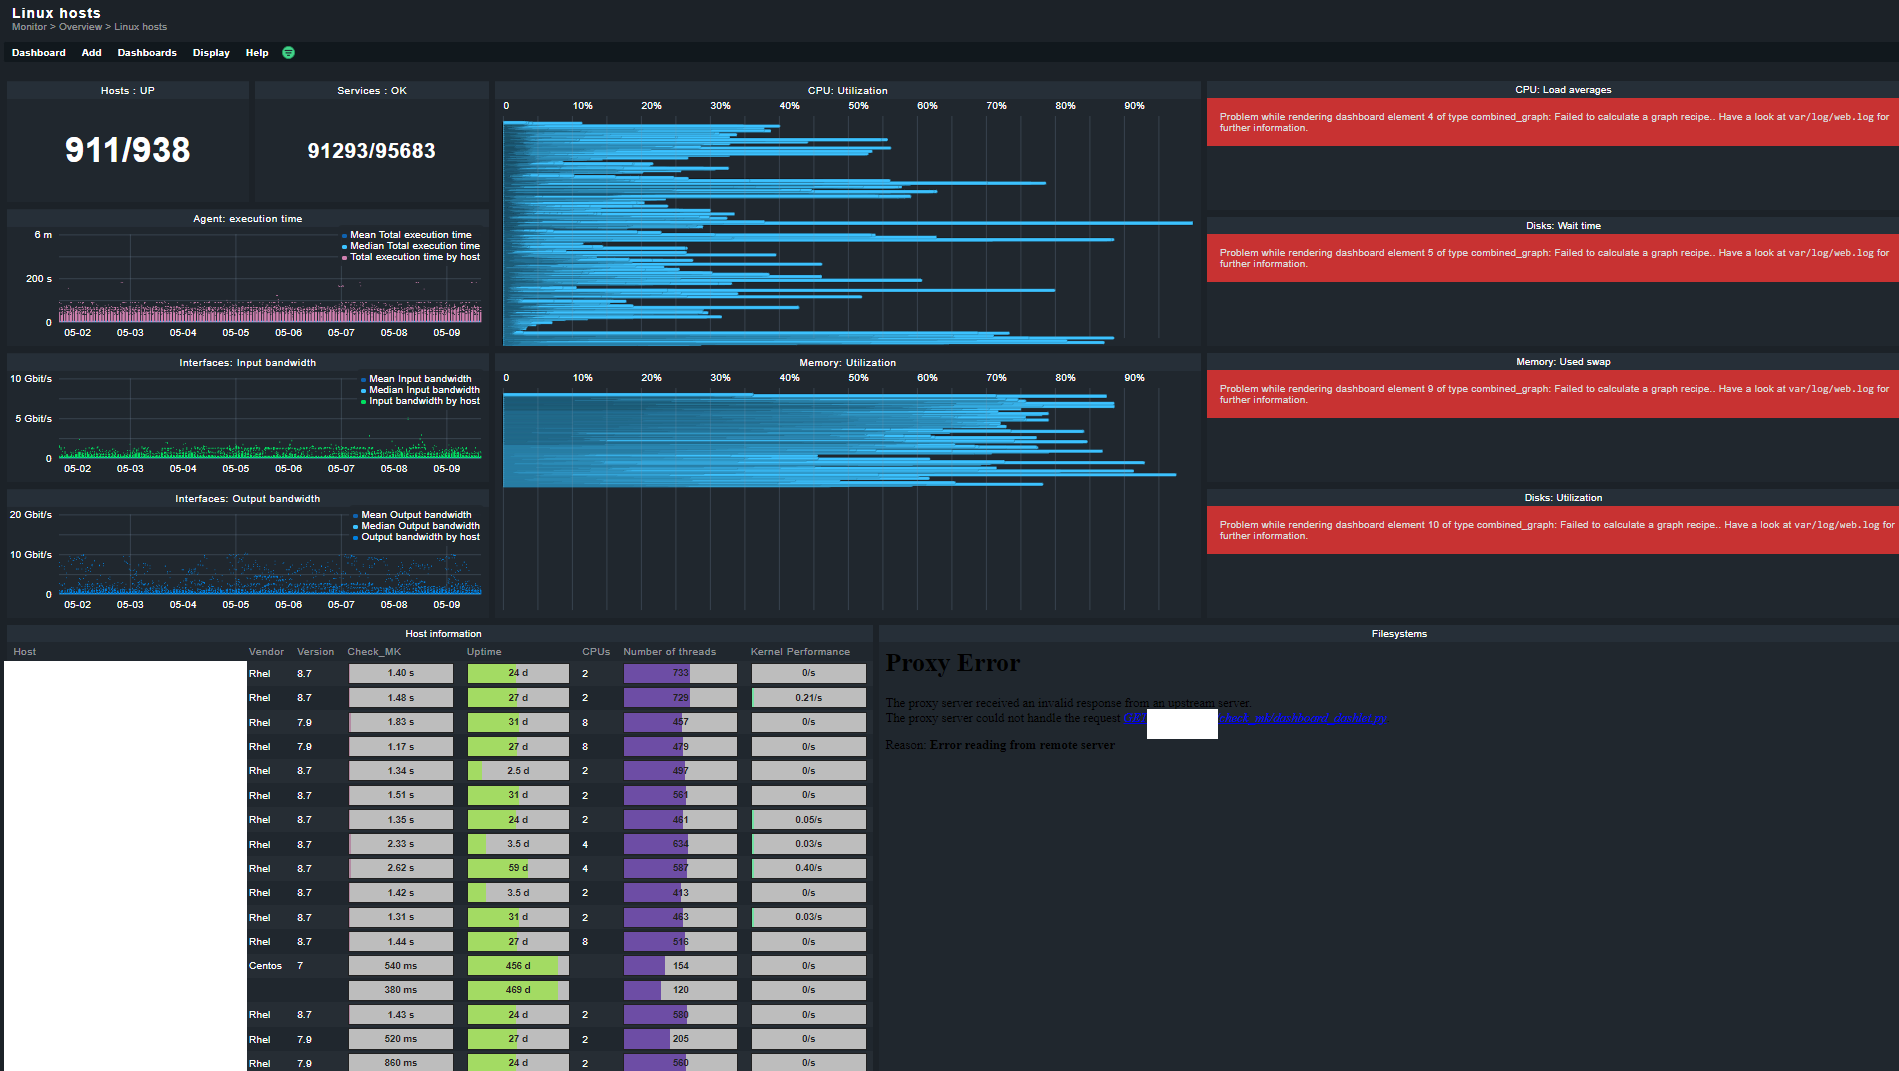
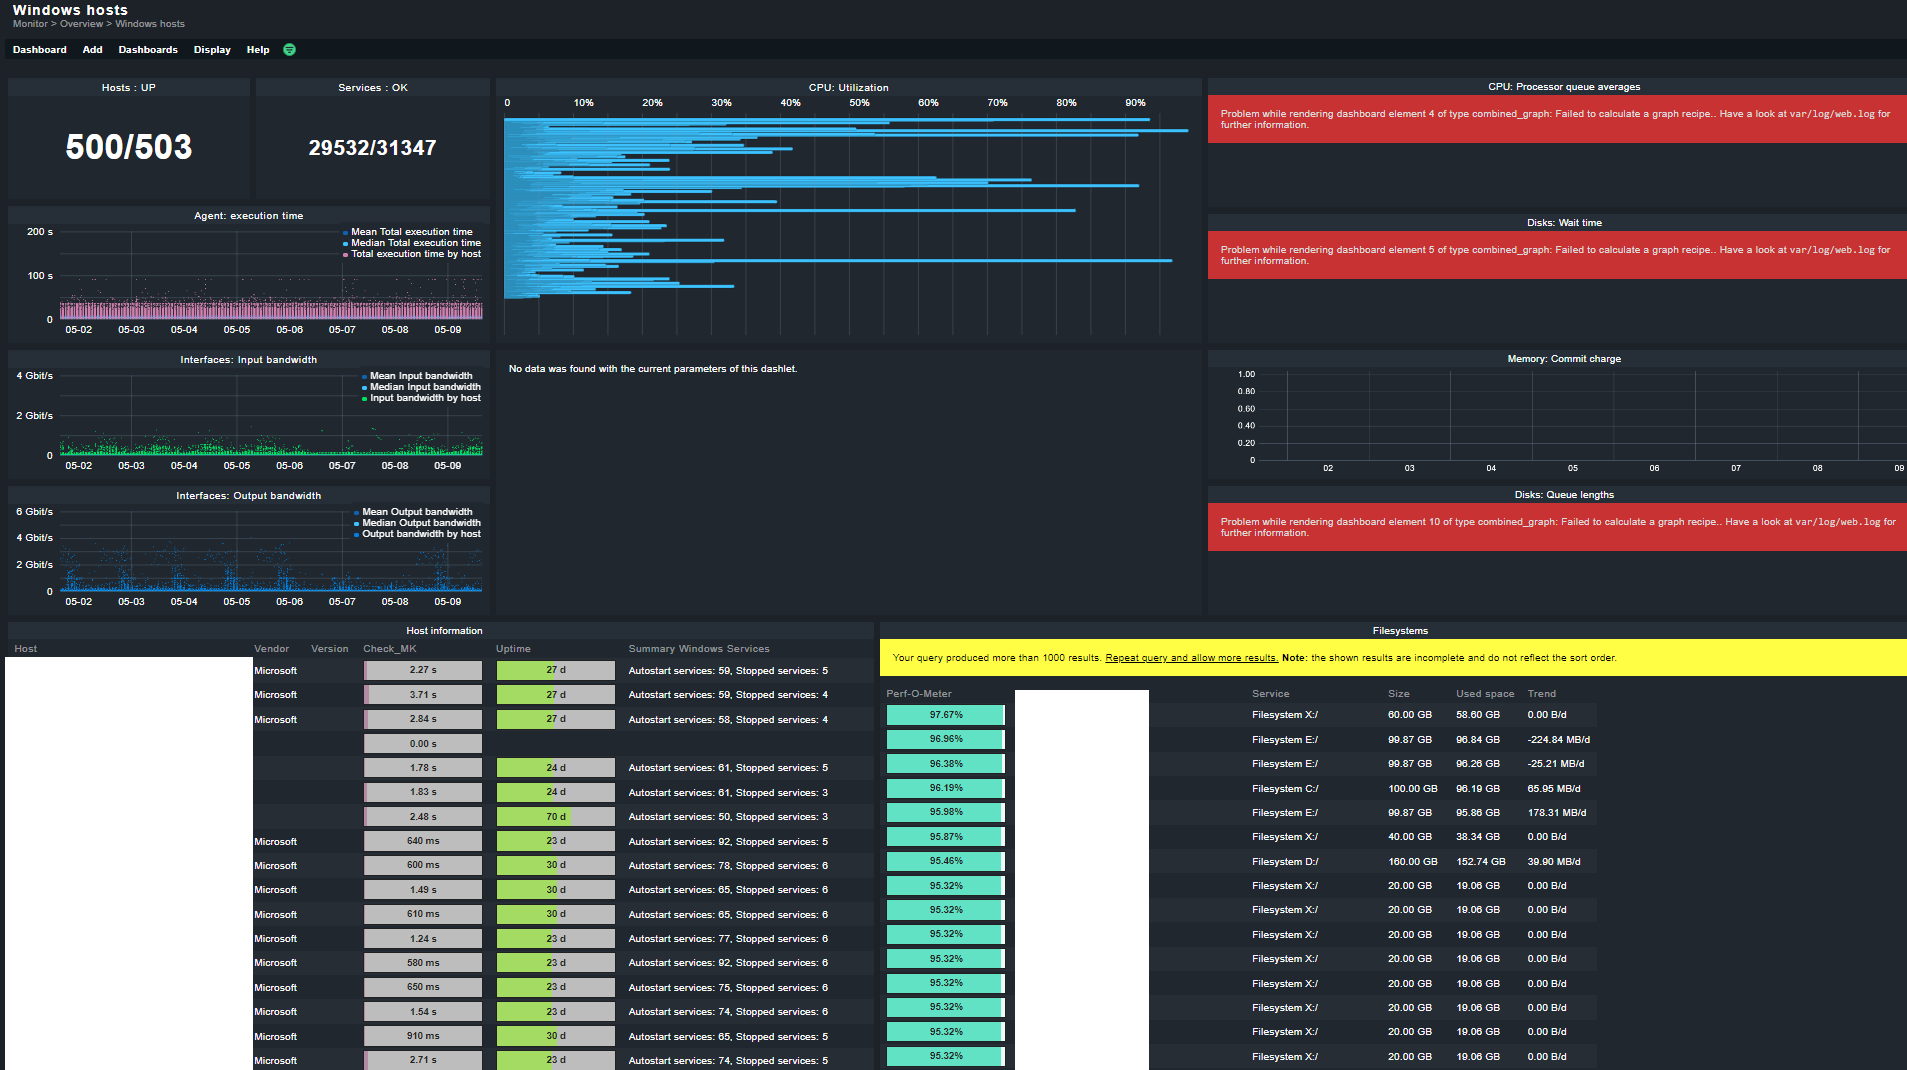
Hey Daniel, I think the OS dashboards are not suitable for this amount of hosts. They were not build for that amount of hosts, also because the amount of data becomes incomprehensible at that level.
Best is to set some filter on them on the dashboard level. Sorry!
For such dashboards, the top 10 dashlet (top 10 filtering) would be a great solution, because then you can make even dashboards across your entire infrastructure work
would it make sense to prevent dashboards from being opened with more than X hosts by default?
I think a lot of users will open these dashboards and stumble over this :/. (Or wait 2 minutes until they notice it…)
Hi,
Dashboards that stop working as soon as you have X hosts are not so cool.
Why not build them so that they work with multiple hosts? The number of customers who have more than 500 hosts is not small, i guess.
One thing we already did is to fix the error message and increase the limit for the graphs which contain more than 100 metrics to 200 metrics.
When building dashboards, one has to make a conscious decision: for what number of hosts/services do you optimize them for. Let’s do two examples:
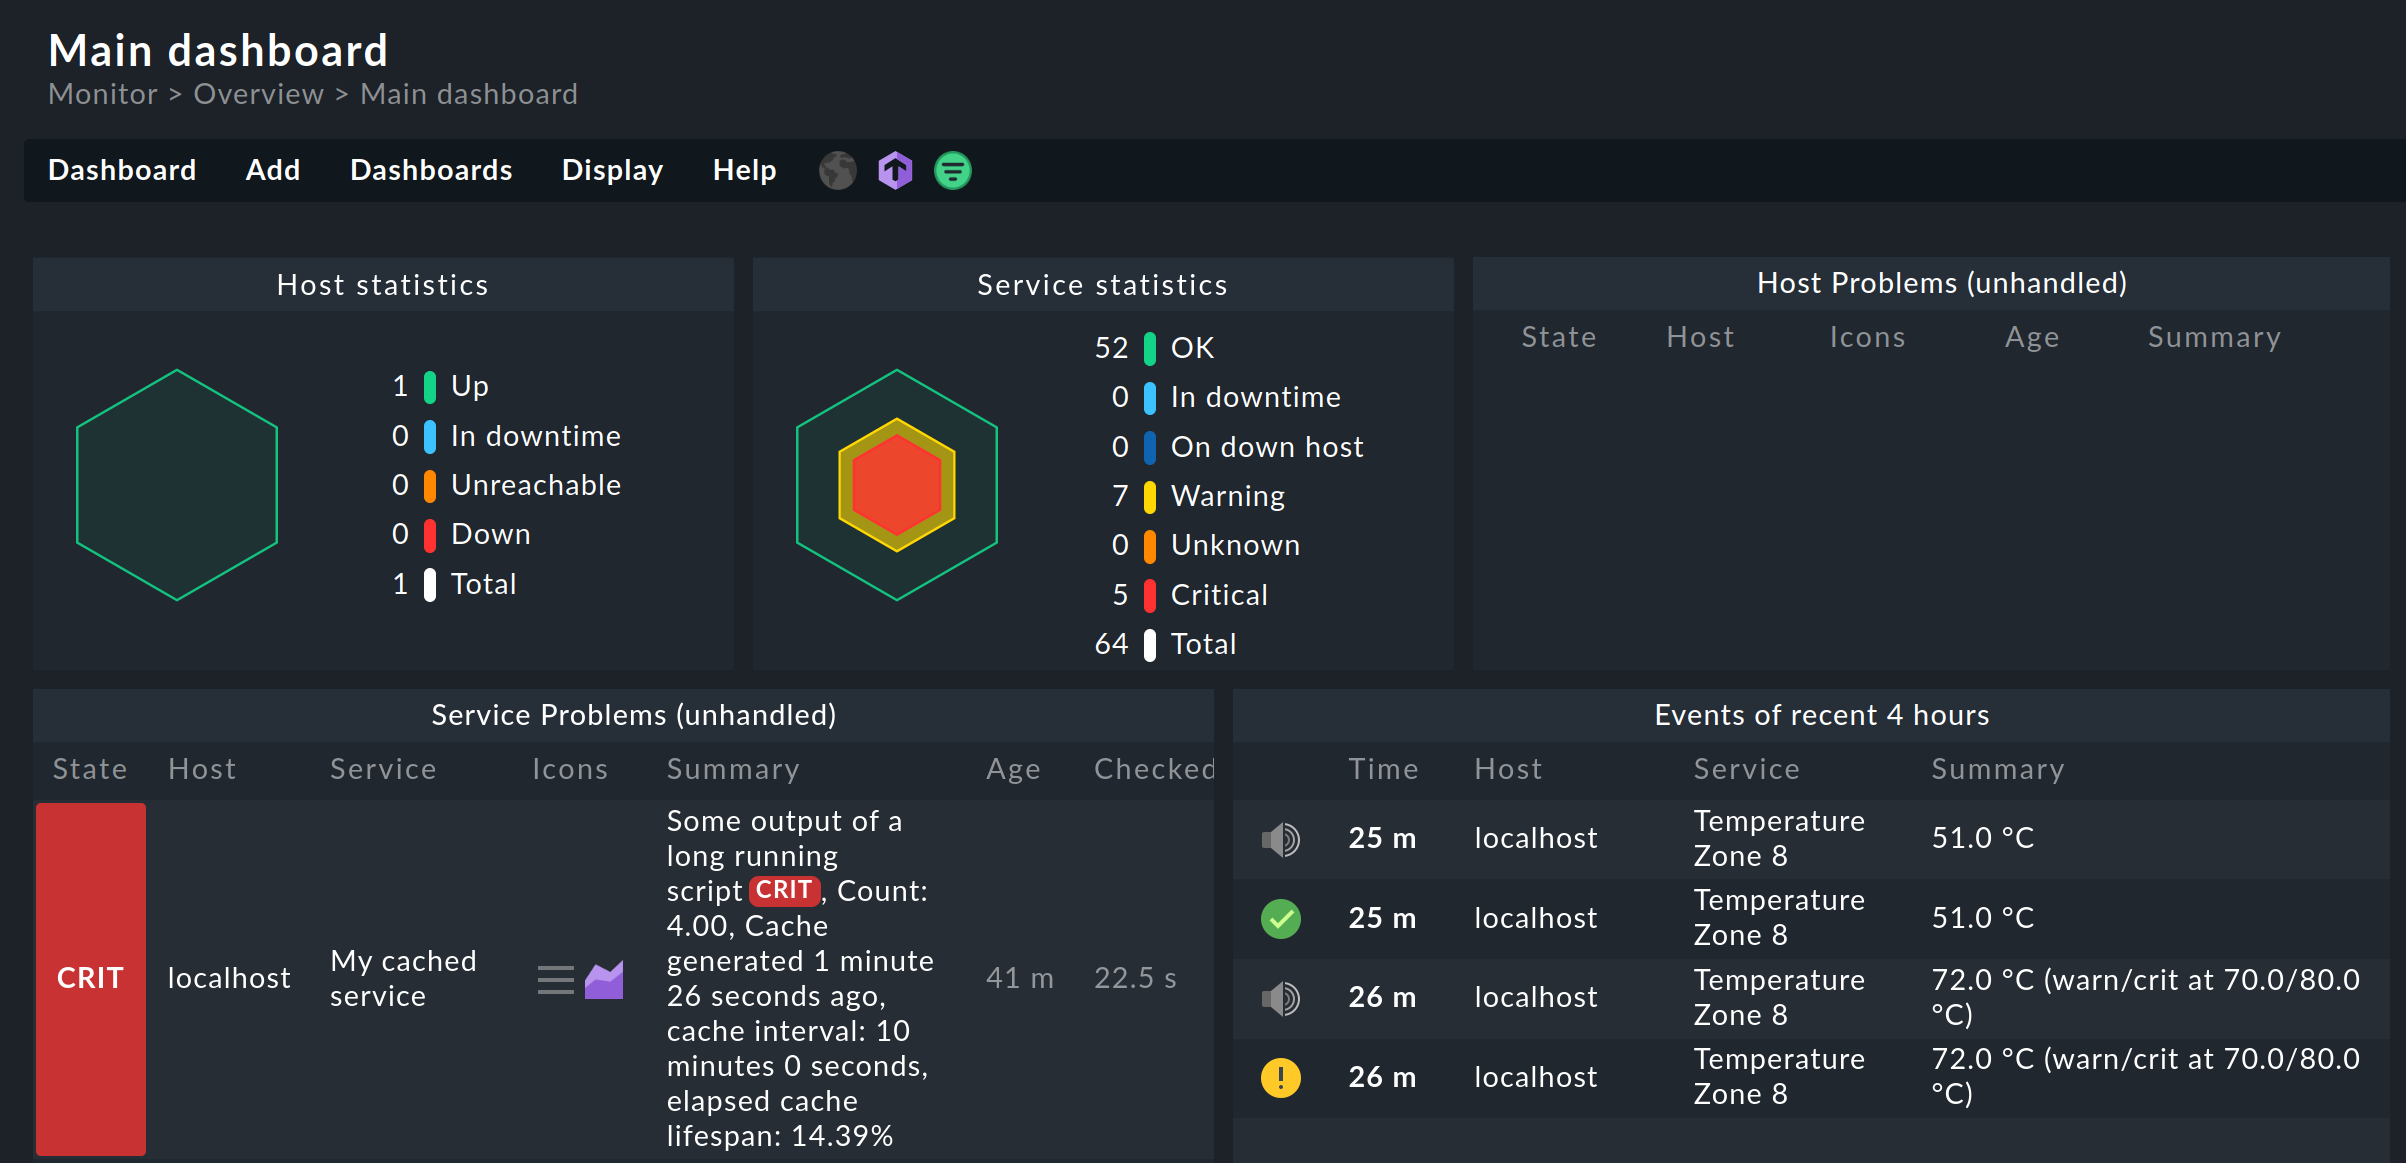
The problem dashboard can deal basically with unlimited number of hosts/services. It highlights issues. It doesn’t give you however analysis / insight options.
The OS dashboards visualize data across your infrastructure. It helps to detect outliers and better understand your infrastructure. This only works with a limited amount of information as most brains can’t process too much data.
Thus, the wish to have dashboards work for everything would limit what dashboards we can ship with Checkmk. We have received a lot of positive feedback on the OS and server dashboards (once you click into one host, you get a visual overview of the key metrics of a Windows/Linux server). Thus, we understand that for many users, there is a value to have these kind of dashboards.
There are a couple ways to move forward:
Gerd’s way to prevent loading of the dashboards (which will also clash with user expectations)
Changing the dashboards, that they work with unlimited hosts/services, which also means that most visualization options will not be possible. This is something I don’t see as an option, because it takes a lot of value away for many users.
Build “dynamic” dashboards, which show visualization options based on the number of hosts (e.g. not a graph if you have >x hosts/services/metrics are there, but a list/beehive instead); we already have that for the site overview dashlet, which acts differently based on number of sites in a monitoring). This is technically quite challenging
Add further visualization elements, which are built for limitless hosts (we have a couple of them already, e.g. site overview (the beehive), average scatterplot, host and service state summary, and any table)
– A further example for that would be the Top 10 hosts dashlet - Checkmk - if it makes sense, please vote for it
We instantly found out that these dashboards would be more or less useless in our environment, even for monitoring only checkmk servers it was not usable (if you have one checkmk server perhaps that would be ok, but once you get over 20 servers the dashboards are so cluttered they make no sense)
Instead we use them as a base and create filters. We have a lot of both host and service labels so we can create dashboards showing a specific datacenter, a specific environment (prod/stage/test) and once we filtered the dashboard we create bookmarks.
So we can have, for example:
DC1
Production
Test
DC2
Production
DC3
Production
Stage
We think some metrics could be useful to combine, aggregate in a dashboard even if you have more than 1000 hosts. For example what is the sum of input/output bandwidth on all switches in a DC? Showing these kinds of metrics we can only do in Grafana today, or using other monitoring tools.
We tried it also with less amount of hosts which seems still very slow or not working properly.
For clarification, for which amount of hosts its made for?
In which version? As it is still present in the 2.1.0p25. Do you have a WERK for it?
Apparently its not working! “Events of recent 4h” broke a couple of times our whole CMK (all GUI activity from all users been “on hold”). We received a workaround (which is also not working anymore), still waiting for a proper fix.
Our amount of hosts and services, if we remember the “conference pin wall”, seems to be still quite on the lower/avarage end.
If no data is shown, its not the brain
Sure, they are ok and useable - but you will not check every host in detail. What you, as a Admin/DC Operator want, is to get a quick overview about the thinks which are not running properly or better, tend to be “out of line” at the moment to even react before thinks alert - proactive and this, for example could help a lot on that.
Lets put it in numbers
Gerd’s suggestion is understandable but also most likly not the best. Even if it seems they are not usefull for the majority of CMK users, there are some. And most likly if created for different OS’s to, might bring some value for even more.
& 3. They could go maybe hand in hand. Some dynamics/options would at least give the user the option to select and filter down on a certain set of hosts with some prominent filters (big button on top)
For example:
Sites
Hostgroups
labels
Not to many as this will become pain in the eye This would already give the advantage to bundle directly the hosts for a specific DC, application, site, type of host, depending the selection and should give it a chance to load in time. As I would asume you might get down asuming starting with 1000 hosts, down to 100 or less?
This feature, to put some “more present” filter buttons for dashboards, would become handy in many dashboards. Also for CME users who could filter by user for instance.
I believe unavoidable as @Anders mentioned, the only way is to aggregate in that way with external tools. OR moving away in general from using your own framework and moving fully into Grafana?
Yes there are many metrics been usefull to aggregate in one dashboard - traffic for DC is a good example, but there is much more of course.
As just stumbled across this
What is the limit here?
Was it tested with an amount of hosts/services which reflects at least the average customer from your “conference pin wall”? Otherwise I fear it might be the same outcome like above.
Regarding my werk, it is targeting DC providers who have to measure their IT utilization for certification purposes. For that, it is meant to be used for hypervisors, bare metal servers. We have tested it in one data center, and will do another test next week in another data center to verify if they fit their purpose. We havent run so far into performance issues for these views when handling up to 500 servers. Thats also fine regarding the specific requirements of the users requiring these views.
I will reply to your other questions when I am back from vacation. The limits of views will however depend largely on the sizing of your Checkmk server as well, so there is no one fits all answer.
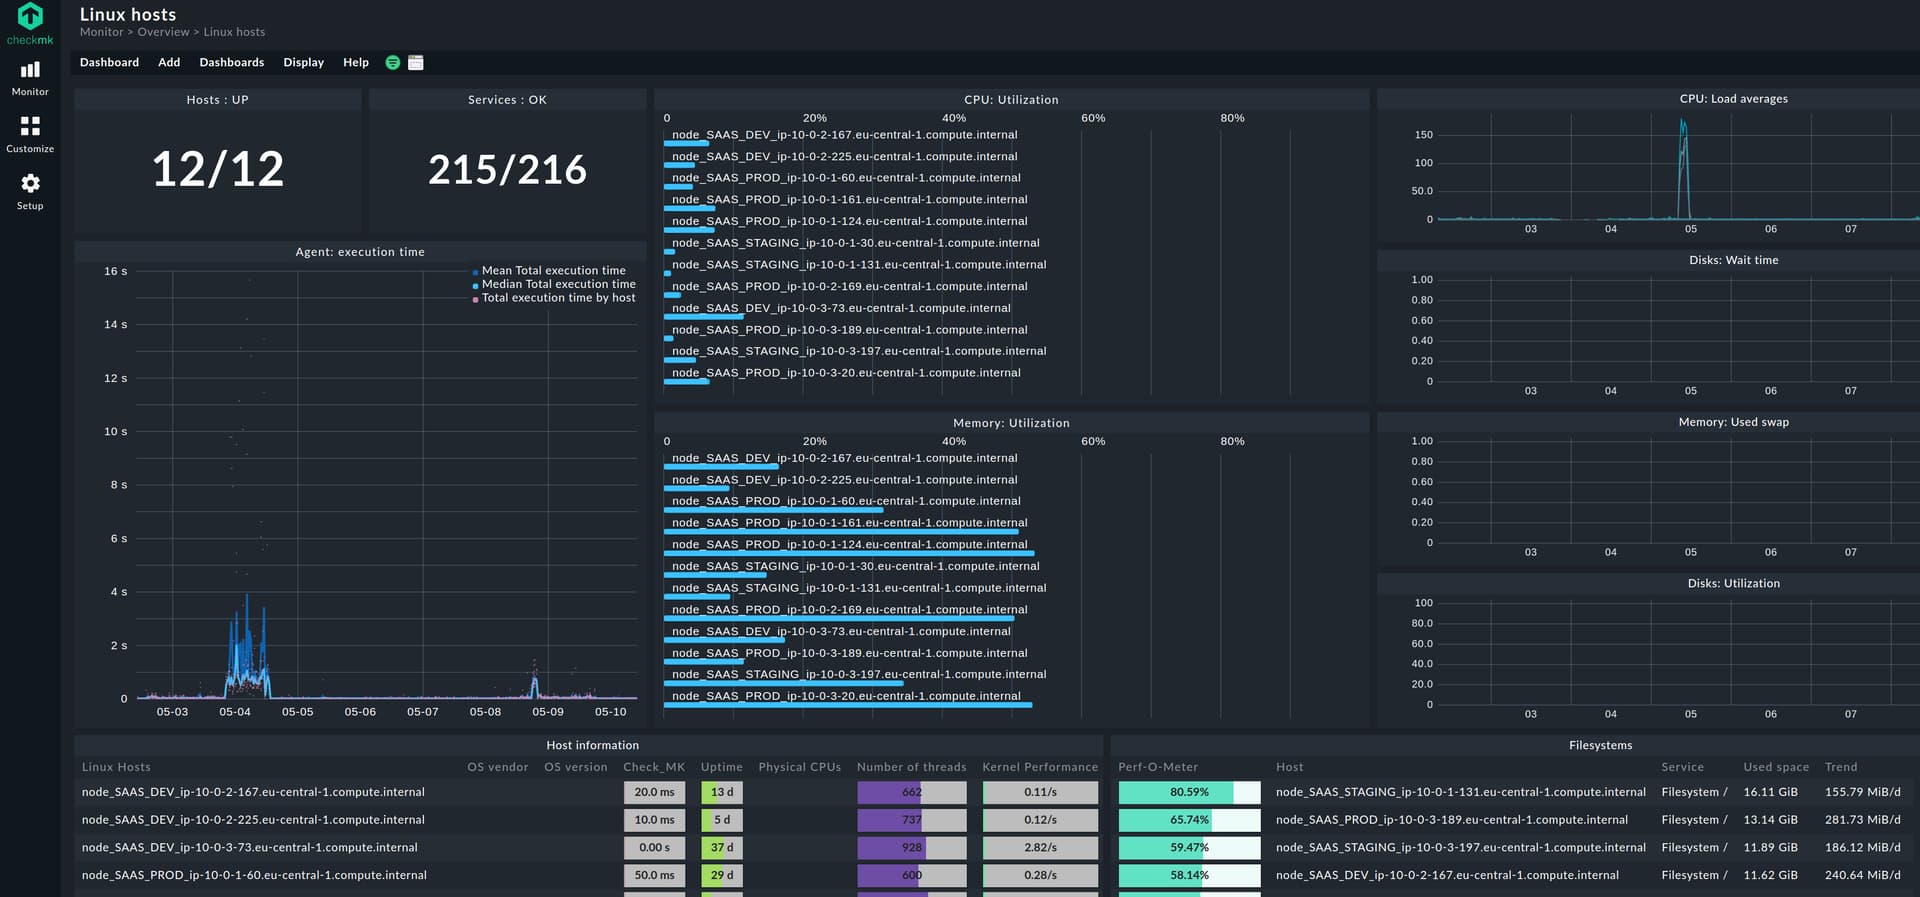
For me, these dashboards work best for less than 10 servers. Then I can still make sense of the metrics I can see and the bar charts are still distinguishable.
If you want dashboards for a larger amount of servers, I can only recommend to use the existing ones as blueprints, which showcase what is in general possible and adapt them to your needs. E.g. use decently sized average scatter plots instead of graphs, use summary service or host views, use less bar charts but give them more space, work with views and use perf-o-meters and so on.
I didn’t find the werk right away, but in 2.2.0b7 it looks like this. It was among the beta feedback to fix the error message, thus we fixed it and along the way also adjusted the limit of metrics for this kind of graphs.
I have seen that feature request and I personally would also like it. I see a lot of benefits coming along with this. This would indeed reduce the pain for any dashboard.
Yes, a possibility to do math functions within graphs for sure is helpful. We have also discussed it internally several times already.
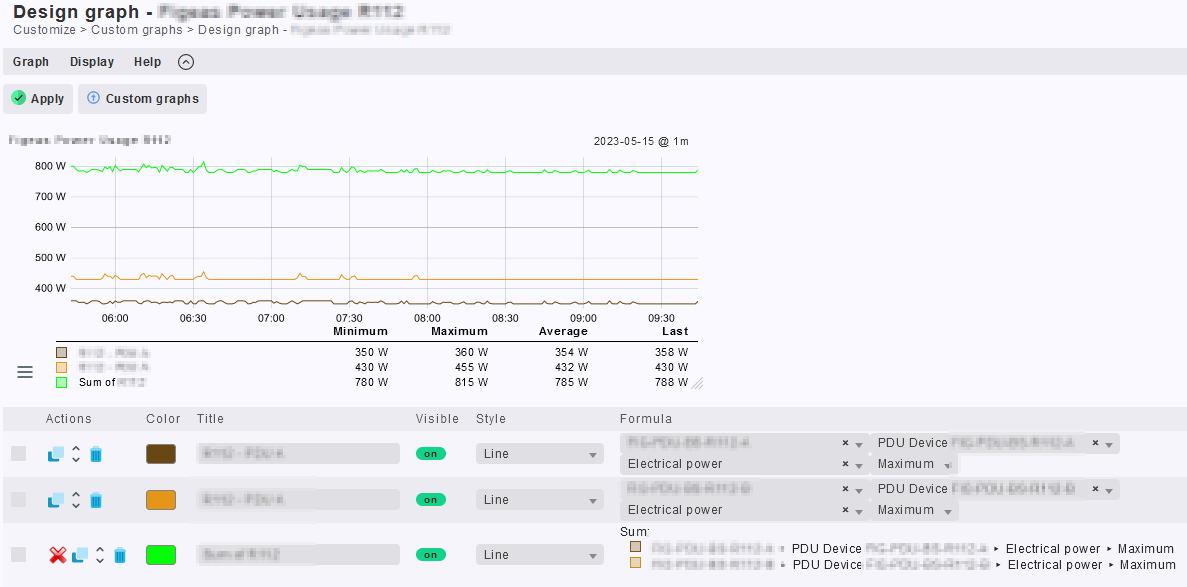
It’s not like it’s impossible at the moment to do so, but the way how to do it is far from accessible. Here is an example I recently saw.
We have decided that the right strategy for us and for the majority of our users is to
a) build integrations into tools, which are complementary in this regard. We have invested a lot in this regard in the last releases (2.1 and 2.2) with the Grafana and InfluxDB integations.
b) extend our capabilities for views, graphing & dashboarding. Especially with Checkmk 2.0 and 2.1, we did quite a lot in this regard. We have several smaller improvements for views also in Checkmk 2.2, thanks to you.
I am happy to discuss this strategy over a beer at the Checkmk conference, but this is not the right place for further discussion on that specific topic.
My conclusion from the discussion so far is:
We need to improve the built-in dashboards.
a) Make their use case / purpose clear (small set of hosts).
b) Complement the existing dashboards with new ones, which are for a larger set of hosts (we have planned to implement the top 10 dashlet for Checkmk 2.3, which should help in this regard, more on this at the Checkmk conference, where we will share the roadmap)
c) Evaluate how we can eventually build dashboards which work for any size of hosts (there are many options how to do so as discussed in this thread)
For further discussion on this topic which would require my input/stance, please write me a PM. I am also very happy to discuss this at the Checkmk conference next month.
This topic was automatically closed 365 days after the last reply. New replies are no longer allowed. Contact an admin if you think this should be re-opened.