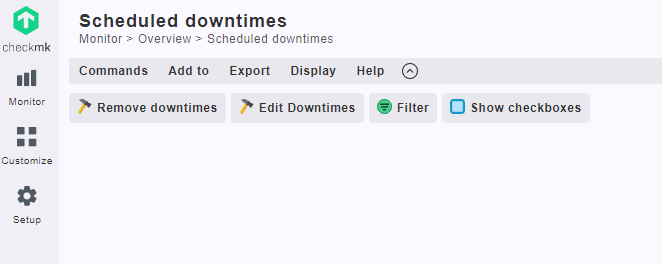
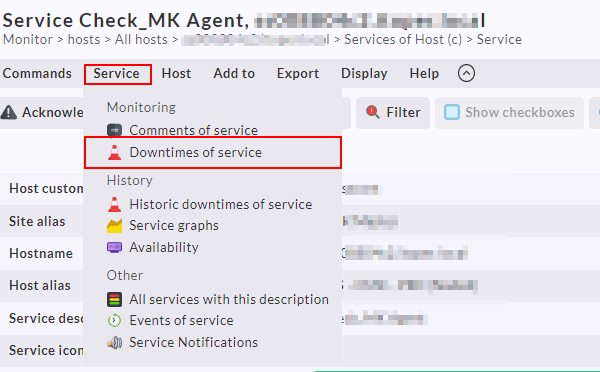
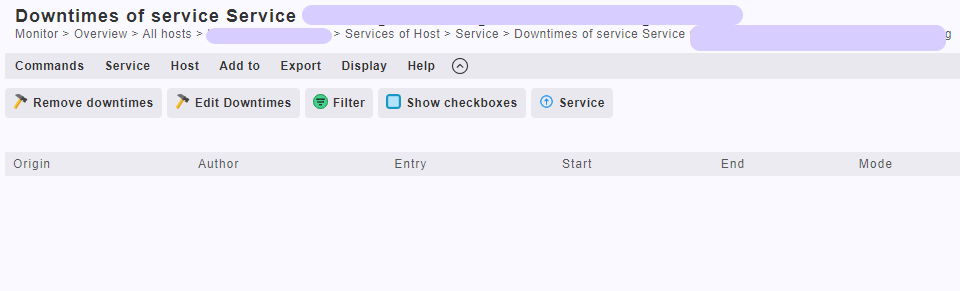
I want to edit a previously added recurring scheduled downtime, but the list of scheduled downtimes is empty → Monitor > Overview > Scheduled downtimes
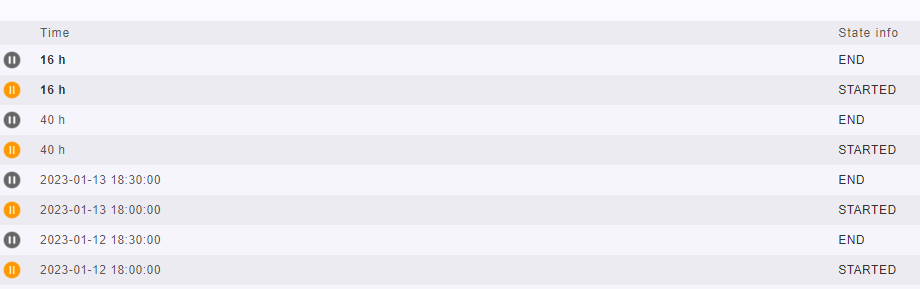
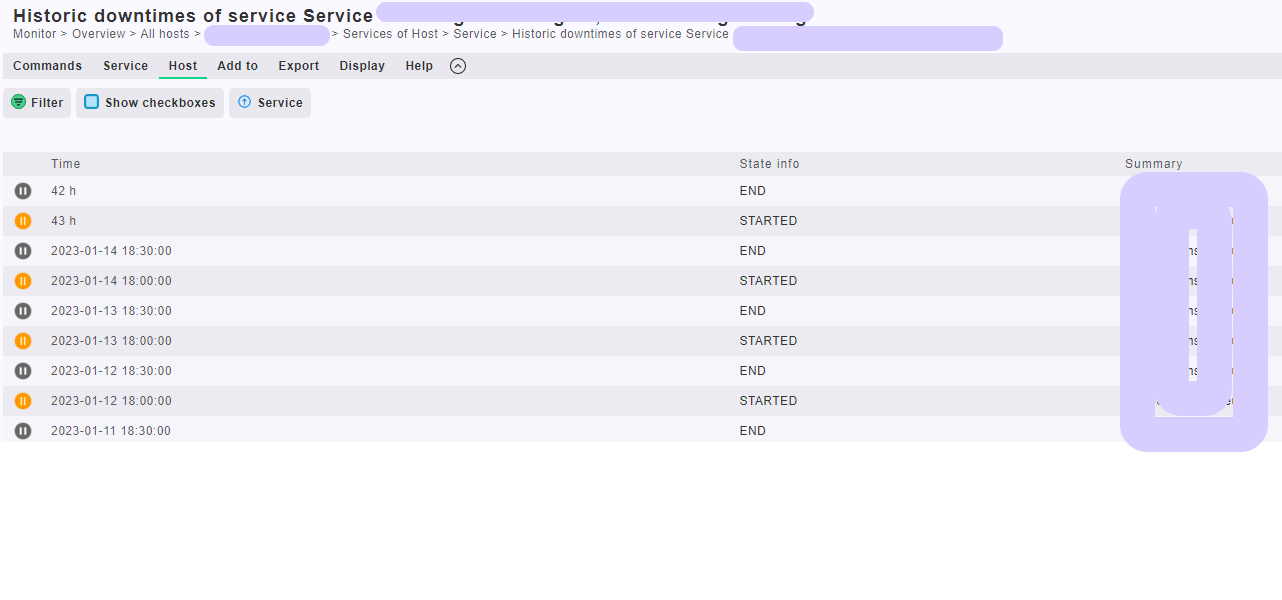
I can review the the historic downtime events of that specific service and I know that it’s working because I’m getting notifications about start/end of that downtime.
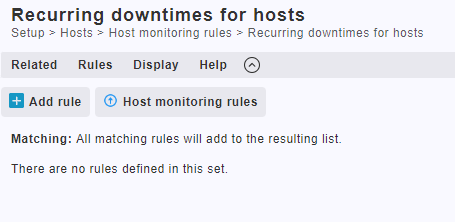
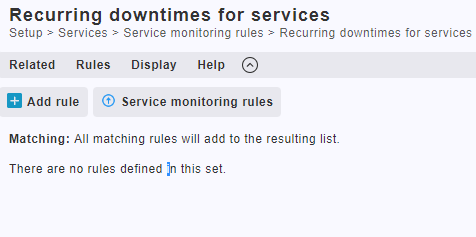
I guess it’s not a configured recurring downtime (via ruleset). Instead it might have been created by “command”, i.e. by checking the “Repeat this downtime on a regular basis” checkbox when issuing a “normal” downtime.
As long as you cannot display it, I have no idea how to remove it.
AFAIK, a downtime which is set via command (instead of configuration = ruleset) is not part of the configuration and thus not found below the etc/check_mk/conf.d/wato/ directory, but is held in the state of the core (Nagios or CMC). Not sure how to act on that (or even check on it) if it’s not shown in the normal UI.
Something strange about the core’s state … I assume you have already restartet the site?
Restarting the site (or at least the core) is surely worth a try.
But I wouldn’t bet on it to help in this case, since the core (of course) retains its state via restarts.
It is saved in a state file, AFAIK var/check_mk/core/state.pb – but that’s binary, I’m afraid, and I have no idea about the format.
This topic was automatically closed 365 days after the last reply. New replies are no longer allowed. Contact an admin if you think this should be re-opened.