Certificate check fails

CMK version: 2.1.0p20
OS version: Ubuntu 18.04

Error message:

Output of “cmk --debug -vvn hostname”: (If it is a problem with checks or plugins)

OMD[monitoring]:~$ cmk --debug -vvn ms.myhost.com
Checkmk version 2.1.0p20
Try license usage history update.
Trying to acquire lock on /omd/sites/monitoring/var/check_mk/license_usage/next_run
Got lock on /omd/sites/monitoring/var/check_mk/license_usage/next_run
Trying to acquire lock on /omd/sites/monitoring/var/check_mk/license_usage/history.json
Got lock on /omd/sites/monitoring/var/check_mk/license_usage/history.json
Next run time has not been reached yet. Abort.
Releasing lock on /omd/sites/monitoring/var/check_mk/license_usage/history.json
Released lock on /omd/sites/monitoring/var/check_mk/license_usage/history.json
Releasing lock on /omd/sites/monitoring/var/check_mk/license_usage/next_run
Released lock on /omd/sites/monitoring/var/check_mk/license_usage/next_run
+ FETCHING DATA
  Source: SourceType.HOST/FetcherType.TCP
[cpu_tracking] Start [7f5d84bb4be0]
[TCPFetcher] Fetch with cache settings: DefaultAgentFileCache(ms.myhost.com, base_path=/omd/sites/monitoring/tmp/check_mk/cache, max_age=MaxAge(checking=0, discovery=120, inventory=120), disabled=False, use_outdated=False, simulation=False)
Not using cache (Too old. Age is 45 sec, allowed is 0 sec)
[TCPFetcher] Execute data source
Connecting via TCP to 3.93.26.51:6556 (5.0s timeout)
Detected transport protocol: TransportProtocol.PLAIN (b'<<')
Reading data from agent
Write data to cache file /omd/sites/monitoring/tmp/check_mk/cache/ms.myhost.com
Trying to acquire lock on /omd/sites/monitoring/tmp/check_mk/cache/ms.myhost.com
Got lock on /omd/sites/monitoring/tmp/check_mk/cache/ms.myhost.com
Releasing lock on /omd/sites/monitoring/tmp/check_mk/cache/ms.myhost.com
Released lock on /omd/sites/monitoring/tmp/check_mk/cache/ms.myhost.com
Closing TCP connection to 3.93.26.51:6556
[cpu_tracking] Stop [7f5d84bb4be0 - Snapshot(process=posix.times_result(user=0.0, system=0.0, children_user=0.0, children_system=0.0, elapsed=0.619999997317791))]
  Source: SourceType.HOST/FetcherType.PIGGYBACK
[cpu_tracking] Start [7f5d84bb47f0]
[PiggybackFetcher] Fetch with cache settings: NoCache(ms.myhost.com, base_path=/omd/sites/monitoring/tmp/check_mk/data_source_cache/piggyback, max_age=MaxAge(checking=0, discovery=120, inventory=120), disabled=True, use_outdated=False, simulation=False)
Not using cache (Cache usage disabled)
[PiggybackFetcher] Execute data source
No piggyback files for 'ms.myhost.com'. Skip processing.
No piggyback files for '3.93.26.51'. Skip processing.
Not using cache (Cache usage disabled)
[cpu_tracking] Stop [7f5d84bb47f0 - Snapshot(process=posix.times_result(user=0.010000000000000009, system=0.0, children_user=0.0, children_system=0.0, elapsed=0.0))]
+ PARSE FETCHER RESULTS
  Source: SourceType.HOST/FetcherType.TCP
<<<check_mk>>> / Transition NOOPParser -> HostSectionParser
<<<cmk_agent_ctl_status:sep(0)>>> / Transition HostSectionParser -> HostSectionParser
<<<checkmk_agent_plugins_lnx:sep(0)>>> / Transition HostSectionParser -> HostSectionParser
<<<labels:sep(0)>>> / Transition HostSectionParser -> HostSectionParser
<<<df>>> / Transition HostSectionParser -> HostSectionParser
<<<systemd_units>>> / Transition HostSectionParser -> HostSectionParser
<<<nfsmounts>>> / Transition HostSectionParser -> HostSectionParser
<<<cifsmounts>>> / Transition HostSectionParser -> HostSectionParser
<<<mounts>>> / Transition HostSectionParser -> HostSectionParser
<<<ps_lnx>>> / Transition HostSectionParser -> HostSectionParser
<<<mem>>> / Transition HostSectionParser -> HostSectionParser
<<<cpu>>> / Transition HostSectionParser -> HostSectionParser
<<<uptime>>> / Transition HostSectionParser -> HostSectionParser
<<<lnx_if>>> / Transition HostSectionParser -> HostSectionParser
<<<lnx_if:sep(58)>>> / Transition HostSectionParser -> HostSectionParser
<<<tcp_conn_stats>>> / Transition HostSectionParser -> HostSectionParser
<<<diskstat>>> / Transition HostSectionParser -> HostSectionParser
<<<kernel>>> / Transition HostSectionParser -> HostSectionParser
<<<md>>> / Transition HostSectionParser -> HostSectionParser
<<<vbox_guest>>> / Transition HostSectionParser -> HostSectionParser
<<<job>>> / Transition HostSectionParser -> HostSectionParser
<<<local:sep(0)>>> / Transition HostSectionParser -> HostSectionParser
No persisted sections
  -> Add sections: ['check_mk', 'checkmk_agent_plugins_lnx', 'cifsmounts', 'cmk_agent_ctl_status', 'cpu', 'df', 'diskstat', 'job', 'kernel', 'labels', 'lnx_if', 'local', 'md', 'mem', 'mounts', 'nfsmounts', 'ps_lnx', 'systemd_units', 'tcp_conn_stats', 'uptime', 'vbox_guest']
  Source: SourceType.HOST/FetcherType.PIGGYBACK
No persisted sections
  -> Add sections: []
Received no piggyback data
[cpu_tracking] Start [7f5d85c88a60]
value store: synchronizing
Trying to acquire lock on /omd/sites/monitoring/tmp/check_mk/counters/ms.myhost.com
Got lock on /omd/sites/monitoring/tmp/check_mk/counters/ms.myhost.com
value store: loading from disk
Releasing lock on /omd/sites/monitoring/tmp/check_mk/counters/ms.myhost.com
Released lock on /omd/sites/monitoring/tmp/check_mk/counters/ms.myhost.com
CPU load             15 min load: 0.00, 15 min load per core: 0.00 (8 cores)
CPU utilization      Total CPU: 0.22%
Check_MK Agent       Version: 2.1.0p20, OS: linux, TLS is not activated on monitored host (see details)(!), Agent plugins: 0, Local checks: 0
Disk IO SUMMARY      Read: 0.00 B/s, Write: 18.5 kB/s, Latency: 448 microseconds
Filesystem /         14.35% used (13.90 of 96.88 GB), trend: +49.89 kB / 24 hours
Interface 2          [ens5], (up), MAC: 12:D2:C4:D3:FA:B1, Speed: unknown, In: 487 B/s, Out: 2.77 kB/s
Kernel Performance   Process Creations: 2.98/s, Context Switches: 234.78/s, Major Page Faults: 0.00/s, Page Swap in: 0.00/s, Page Swap Out: 0.00/s
Memory               Total virtual memory: 6.71% - 1.02 GB of 15.18 GB, 8 additional details available
Mount options of /   Mount options exactly as expected
Number of threads    308, Usage: 0.25%
Systemd Service Summary Total: 130, Disabled: 5, Failed: 0
TCP Connections      Established: 15
Uptime               Up since Jan 15 2023 09:59:14, Uptime: 29 days 23 hours
No piggyback files for 'ms.myhost.com'. Skip processing.
No piggyback files for '3.93.26.51'. Skip processing.
[cpu_tracking] Stop [7f5d85c88a60 - Snapshot(process=posix.times_result(user=0.020000000000000018, system=0.0, children_user=0.0, children_system=0.0, elapsed=0.009999997913837433))]
[agent] Success, execution time 0.6 sec | execution_time=0.630 user_time=0.030 system_time=0.000 children_user_time=0.000 children_system_time=0.000 cmk_time_agent=0.610

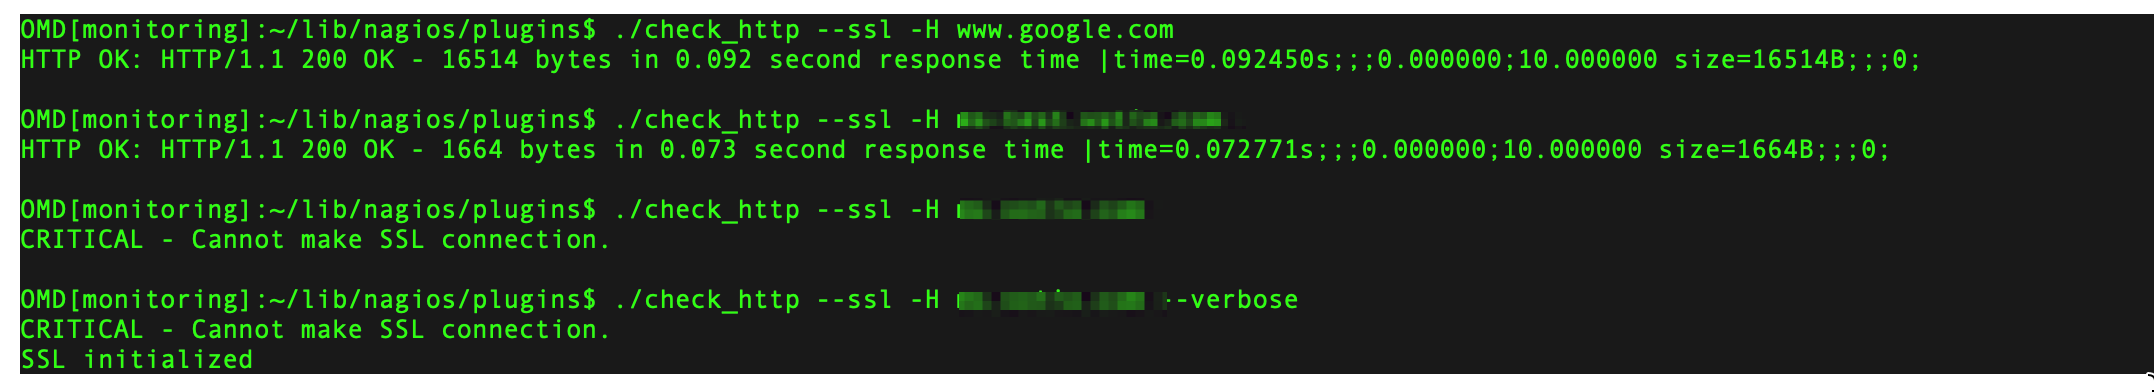
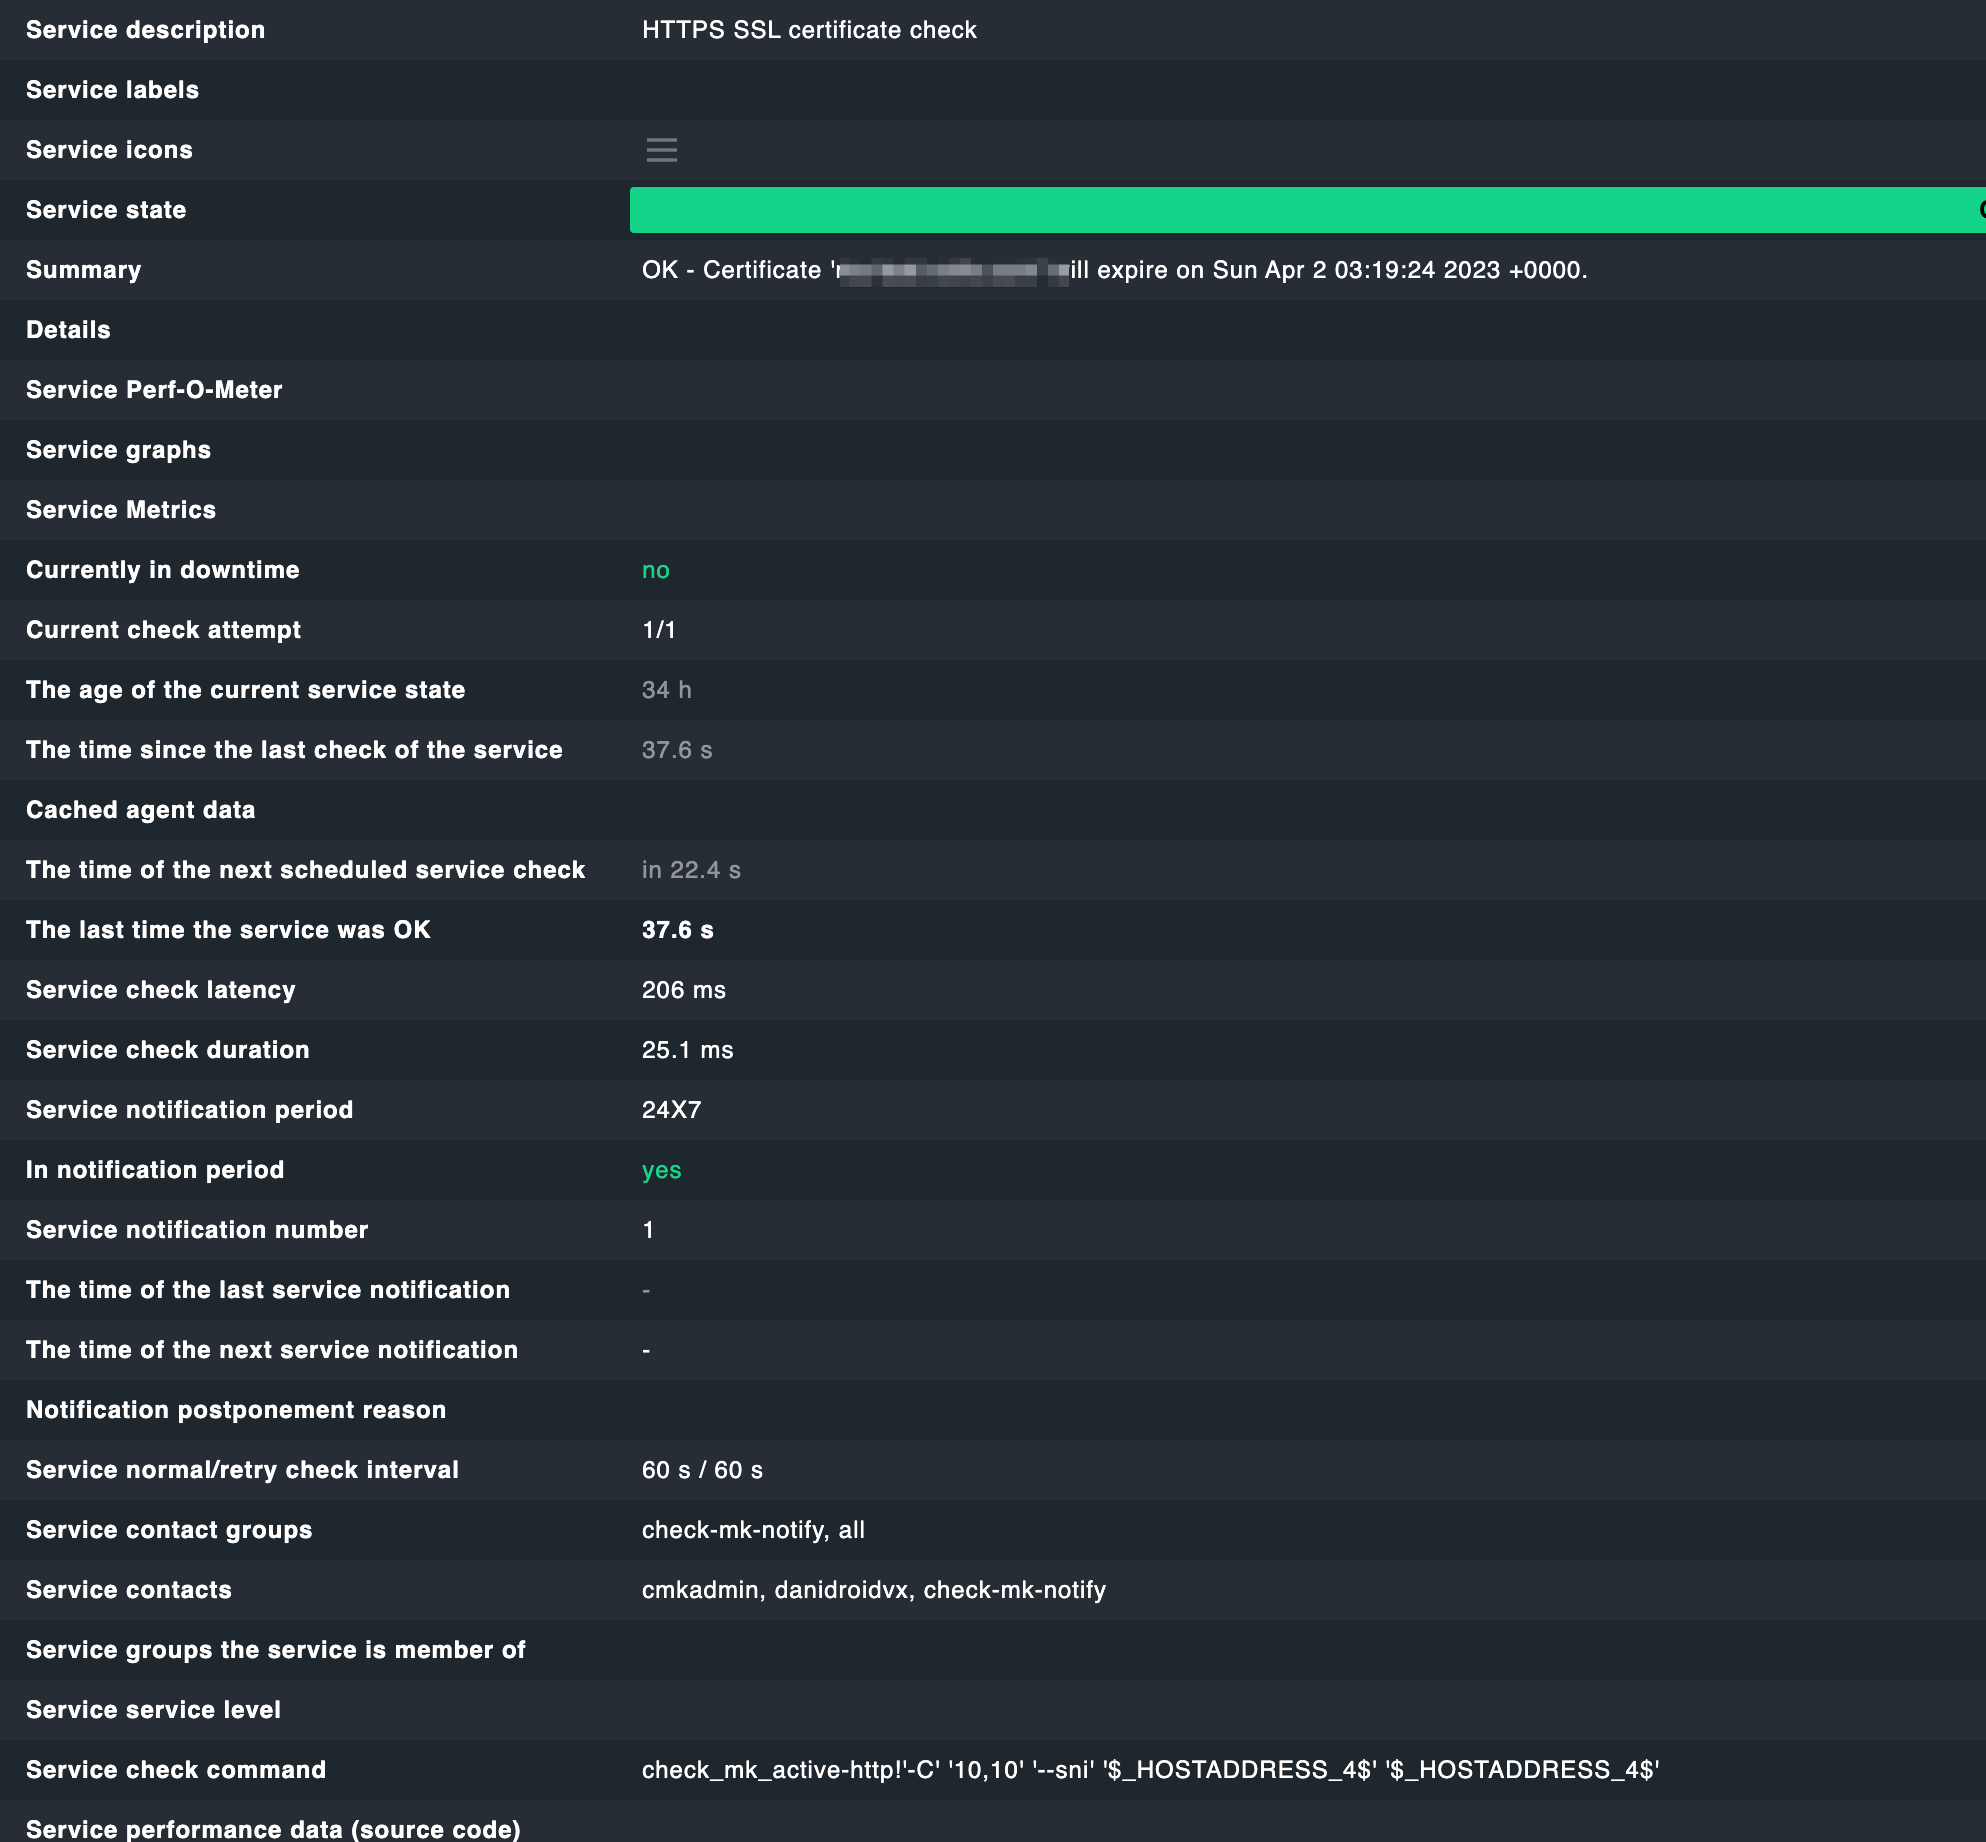
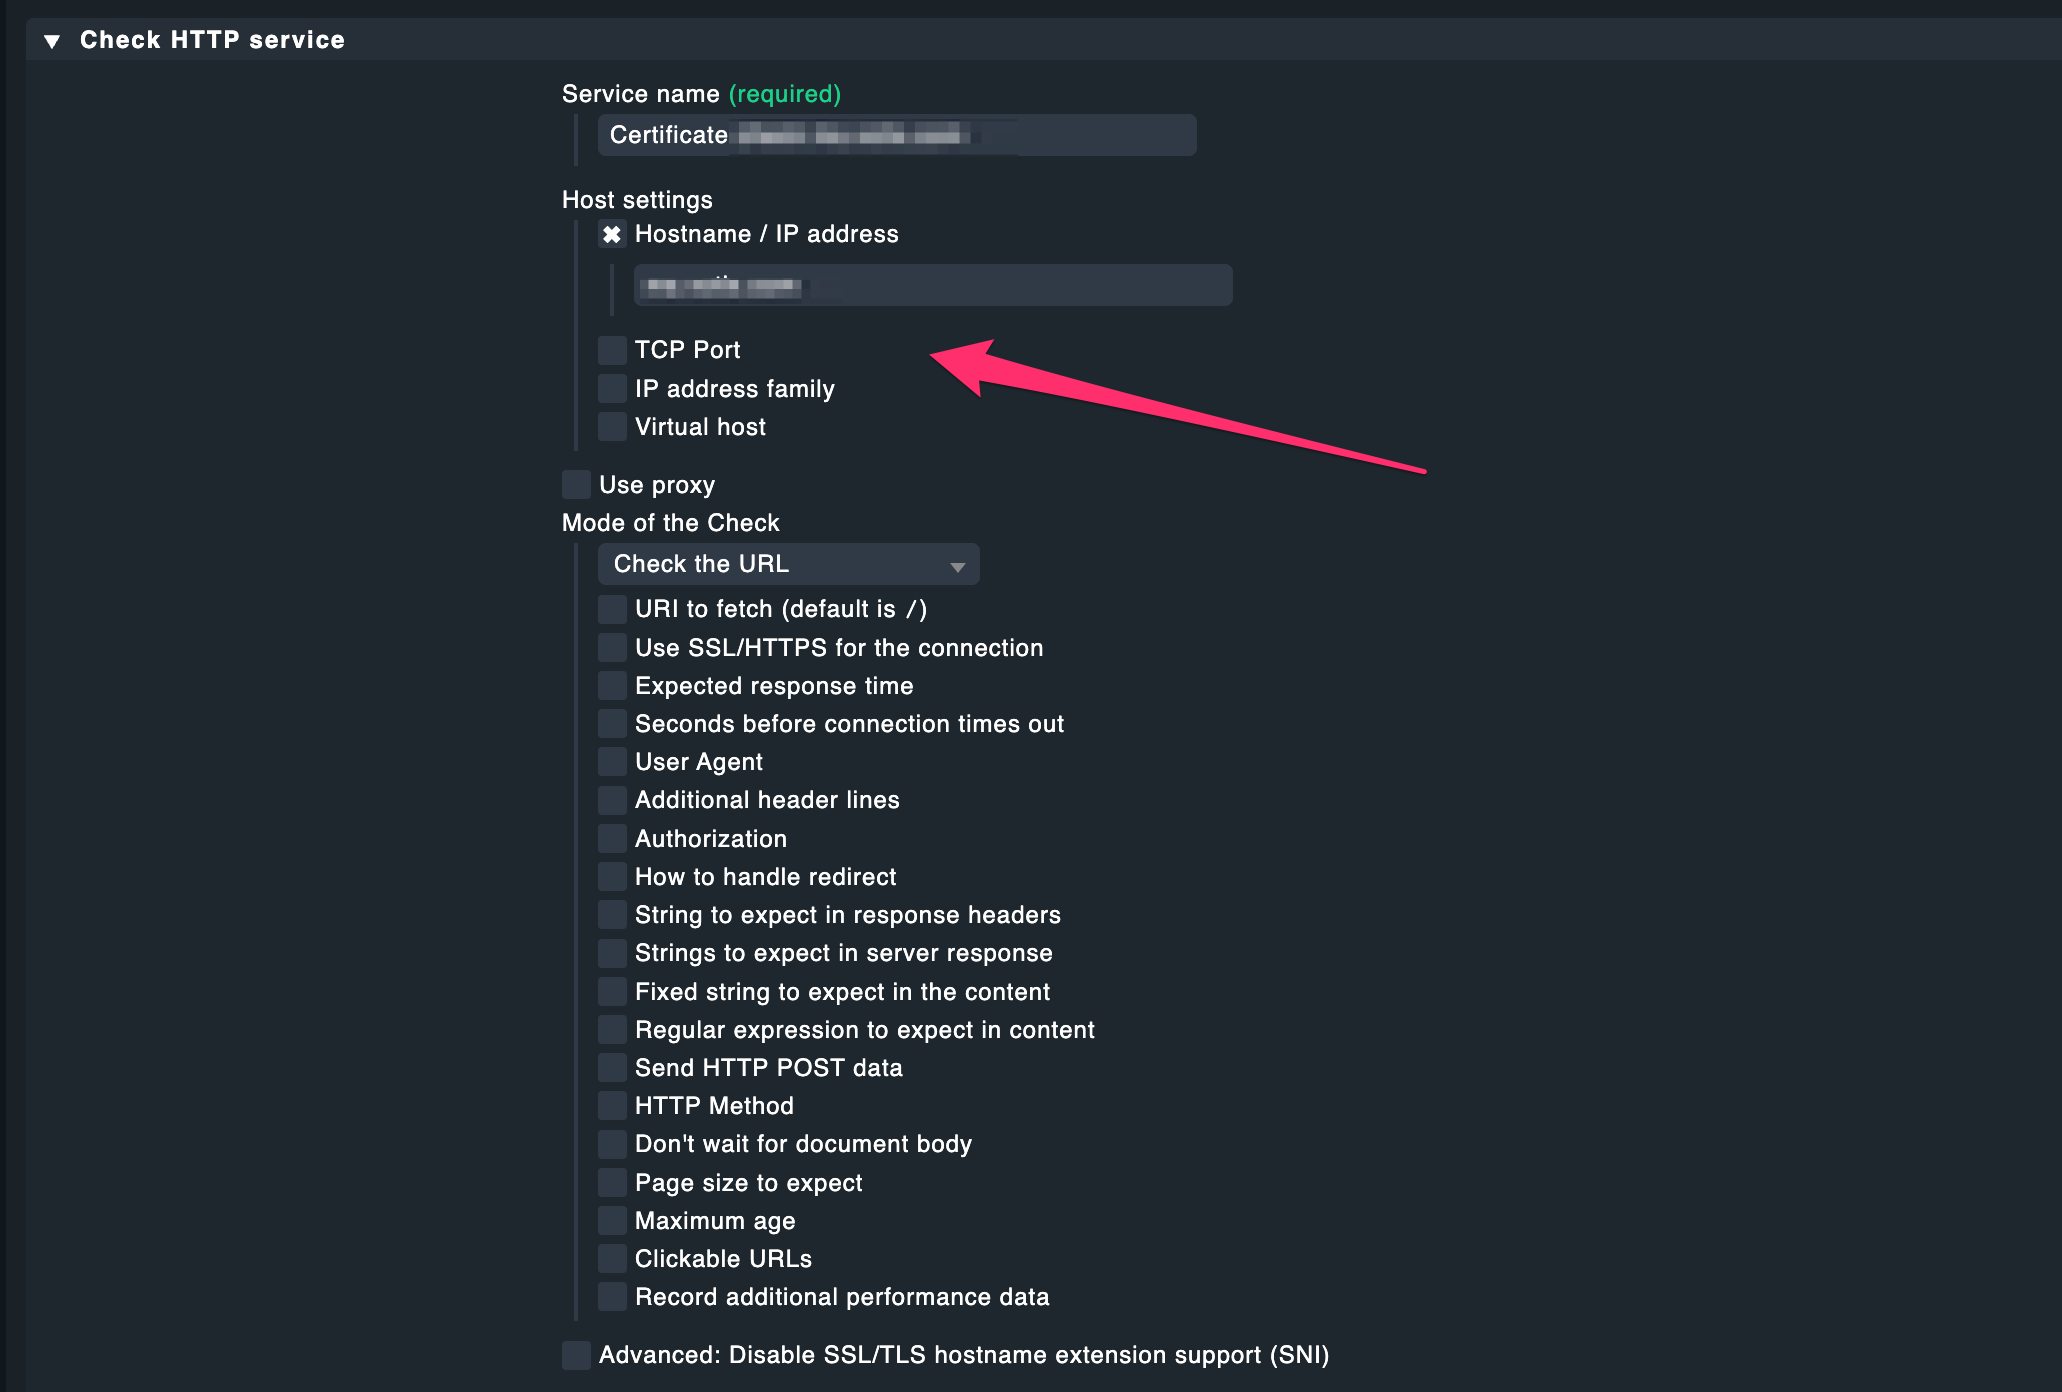
Hi, I’m having several hosts in observation. This one (hostname obfuscated) makes some trouble, even though any other clients (like curl or a browser) don’t have any problem with the certificate.

Any chance to approach the root of the problem?

Some more info on this (I still have no clue, why this fails on identical, but different servers):

The certificate is completely OK in a browser and also curl has no problem to call a “ping” API

What is going on here?

Also, openssl doesn’t see something (or I don’t, having renamed the server to “goodserver” and “badserver”). I was checking, if there is a CA chain problem or so, but both look very similar:

“badserver”

OMD[monitoring]:~$ openssl s_client -connect badserver:443
CONNECTED(00000003)
depth=2 C = US, O = Internet Security Research Group, CN = ISRG Root X1
verify return:1
depth=1 C = US, O = Let's Encrypt, CN = R3
verify return:1
depth=0 CN = badserver
verify return:1
---
Certificate chain
 0 s:CN = badserver
   i:C = US, O = Let's Encrypt, CN = R3
 1 s:C = US, O = Let's Encrypt, CN = R3
   i:C = US, O = Internet Security Research Group, CN = ISRG Root X1
 2 s:C = US, O = Internet Security Research Group, CN = ISRG Root X1
   i:O = Digital Signature Trust Co., CN = DST Root CA X3
---
Server certificate
-----BEGIN CERTIFICATE-----
<<edited-base64-certificate>>
-----END CERTIFICATE-----
subject=CN = badserver

issuer=C = US, O = Let's Encrypt, CN = R3

---
No client certificate CA names sent
Peer signing digest: SHA256
Peer signature type: RSA-PSS
Server Temp Key: X25519, 253 bits
---
SSL handshake has read 4668 bytes and written 407 bytes
Verification: OK
---
New, TLSv1.2, Cipher is ECDHE-RSA-AES256-GCM-SHA384
Server public key is 2048 bit
Secure Renegotiation IS supported
Compression: NONE
Expansion: NONE
No ALPN negotiated
SSL-Session:
    Protocol  : TLSv1.2
    Cipher    : ECDHE-RSA-AES256-GCM-SHA384
    Session-ID: 91621FDEF1840F220239BC8B5F485ABEEFFC7522C21C22B963273A634E698BAC
    Session-ID-ctx: 
    Master-Key: 72A304B3B63FA3ACA6FDB417705FC1CF619568F3509CBA775B6C7D5FD4EDC5B3FC11A950B59065F97448878FDD297762
    PSK identity: None
    PSK identity hint: None
    SRP username: None
    TLS session ticket lifetime hint: 300 (seconds)
    TLS session ticket:
    0000 - 88 21 04 2b 23 58 bf d8-34 18 5e 24 7b a9 ab 0b   .!.+#X..4.^${...
    0010 - b4 b7 87 47 3a 26 78 e7-0d 25 73 4a dc aa 2c 20   ...G:&x..%sJ.., 
    0020 - 93 9c fc 7b 3f 06 71 96-d4 7d 4b 56 ef dd f5 ce   ...{?.q..}KV....
    0030 - c0 72 30 cb 92 59 14 bd-31 4c 42 6f 6a 6f 58 33   .r0..Y..1LBojoX3
    0040 - fe 25 6b 41 07 c0 7b d5-fa 83 21 ae 85 5b e5 ef   .%kA..{...!..[..
    0050 - 04 47 de dd c6 23 03 63-58 5b 3b 9f 20 aa a5 42   .G...#.cX[;. ..B
    0060 - b9 61 fb 78 7e 75 e1 94-72 60 01 a4 b8 d6 00 06   .a.x~u..r`......
    0070 - 43 5a 34 d1 ff db 50 5f-e1 9c b9 96 23 5e ff 00   CZ4...P_....#^..
    0080 - 79 cd e9 b8 c1 b7 95 80-17 27 3b 17 72 ff e3 4e   y........';.r..N
    0090 - b4 6b b9 7d 44 93 a5 b9-a4 c9 28 4d 02 c7 75 98   .k.}D.....(M..u.
    00a0 - a7 bb 95 f1 4c da 35 23-8e c6 ac 04 32 b7 7a 10   ....L.5#....2.z.

    Start Time: 1676374268
    Timeout   : 7200 (sec)
    Verify return code: 0 (ok)
    Extended master secret: yes
---
closed
OMD[monitoring]:~$ 

“goodserver”

OMD[monitoring]:~$ openssl s_client -connect goodserver:443
CONNECTED(00000003)
depth=2 C = US, O = Internet Security Research Group, CN = ISRG Root X1
verify return:1
depth=1 C = US, O = Let's Encrypt, CN = R3
verify return:1
depth=0 CN = goodserver
verify return:1
---
Certificate chain
 0 s:CN = goodserver
   i:C = US, O = Let's Encrypt, CN = R3
 1 s:C = US, O = Let's Encrypt, CN = R3
   i:C = US, O = Internet Security Research Group, CN = ISRG Root X1
 2 s:C = US, O = Internet Security Research Group, CN = ISRG Root X1
   i:O = Digital Signature Trust Co., CN = DST Root CA X3
---
Server certificate
-----BEGIN CERTIFICATE-----
<<edited-base64-certificate>>
-----END CERTIFICATE-----
subject=CN = goodserver

issuer=C = US, O = Let's Encrypt, CN = R3

---
No client certificate CA names sent
Peer signing digest: SHA256
Peer signature type: RSA-PSS
Server Temp Key: X25519, 253 bits
---
SSL handshake has read 4681 bytes and written 412 bytes
Verification: OK
---
New, TLSv1.2, Cipher is ECDHE-RSA-AES256-GCM-SHA384
Server public key is 2048 bit
Secure Renegotiation IS supported
Compression: NONE
Expansion: NONE
No ALPN negotiated
SSL-Session:
    Protocol  : TLSv1.2
    Cipher    : ECDHE-RSA-AES256-GCM-SHA384
    Session-ID: 2EA3E0F2A7526DFBC092FB39840A17A1FB8B914BA74979D10FC0E2702CC39A83
    Session-ID-ctx: 
    Master-Key: B3695D712134B50A6E03E4EE698E504D4F76E7892C83AE5373D0FEF0DAB17EE764B5CC6914FA8DFE8CA2E6FD02A7A542
    PSK identity: None
    PSK identity hint: None
    SRP username: None
    TLS session ticket lifetime hint: 300 (seconds)
    TLS session ticket:
    0000 - e8 1d f5 44 cf 24 c4 3d-9f 95 a7 c4 02 ca 2b e0   ...D.$.=......+.
    0010 - 8b 4b 8e 22 b5 14 7c de-50 f2 3d e9 22 d2 49 01   .K."..|.P.=.".I.
    0020 - 2c c2 9c 74 57 1a 75 75-d0 e9 c0 11 2c 3f 77 9c   ,..tW.uu....,?w.
    0030 - 15 1a 6b 1d e6 f7 78 f5-b8 37 53 0e 11 7b f5 78   ..k...x..7S..{.x
    0040 - 22 1a a2 99 cf 5d 0d 19-9d b7 d8 3a 47 f7 8c 3d   "....].....:G..=
    0050 - 42 aa 7b fa 86 3a 8b fc-78 a9 e9 98 a3 43 21 75   B.{..:..x....C!u
    0060 - be 18 30 eb 77 1b 55 dd-ff 8d 00 14 cf 93 9e 47   ..0.w.U........G
    0070 - 06 db ae 94 c0 8f 07 3b-a9 e6 4e 31 ca 84 fd 3e   .......;..N1...>
    0080 - 54 8e d8 b8 ba ae 45 ee-74 5a 07 c2 43 fd 25 72   T.....E.tZ..C.%r
    0090 - f7 9c 3c eb 29 26 7b c5-69 d1 1b 4f f0 7e 7c 07   ..<.)&{.i..O.~|.
    00a0 - cf bf 41 15 f1 53 85 1b-c8 75 e6 fa 6c c9 1f 90   ..A..S...u..l...

    Start Time: 1676374640
    Timeout   : 7200 (sec)
    Verify return code: 0 (ok)
    Extended master secret: yes
---
closed
OMD[monitoring]:~$ 

Strange, this call works:

OMD[monitoring]:~/lib/nagios/plugins$ ./check_http --ssl -H badserver --sni
HTTP OK: HTTP/1.1 200 OK - 1664 bytes in 0.027 second response time |time=0.026813s;;;0.000000;10.000000 size=1664B;;;0;

and it seems, that --sni makes the difference. Wondering, because it is not disabled for the test.

And if I understand this correctly, then --sni is also configured here:

Pointer very much appreciated…

Well, I don’t have to understand that, do I? Created a new test, specified the hostname

and boom:

Weird, isn’t it? As if “$_HOSTADDRESS_4$” resolves badly for this host…

So you need SNI to pick the correct cert?
And the check fails when you use the IP address to connect?
And give no virtual host?

So there’s no name that would be available for SNI to pick the correct cert, right?

Hi Martin,

the picture is not clear to me:

So you need SNI to pick the correct cert?

Yes, with “–sni” the direct check_http command on console works. But as shown --sni is also defined in the check_mk_active-http command line, so this is in my eyes not the problem, why the check fails

And the check fails when you use the IP address to connect?

No, I was never using the IP directly. The failing test has no neither hostname, nor IP specified. If I create a second test by explicitly specifying the hostname then it works.

And give no virtual host?

Sorry, don’t understand this.

So there’s no name that would be available for SNI to pick the correct cert, right?

Honestly, I don’t know. You see above the openssl test run against the server. Do you see any significant difference?

I have to leave now, but one reason could be a redirect, which is there on this machine. And it is only on this machine, because this has a slightly different NGINX configuration as the others.

At least I see the redirect in response to the direct HTTPS check on this machine:

So for me two possible problems: Either redirect is not followed or $_HOSTADDRESS_4 is not resolved correctly.

I can cross check later by applying the same special test to the working instance.

Didn’t you use “$_HOSTADDRESS_4$”? Sorry if I have overlooked or confused something.

In the check, you can explicitely configure a “virtual host” i.e. the name to send in the “Host:” header. Turn on inline-help to learn more on this.

So if there is no hostname given (either as Host or as Virtual Host) but instead only an IP address, then SNI (albeit enabled) will have no idea which name to present.

On the service page for the http checks, you can scroll down to find the “Service check command” and compare this between a working and a non-working check.

Again, have a look at the inline-help: “Usually Checkmk will nail this check to the primary IP address of the host it is attached to. It will use the corresponding IP version (IPv4/IPv6) and default port (80/443).”

So without any hostname (either as Host or as Virtual Host) there’s no hint for SNI which name to use and it will probably fall through to some default cert.

Many thanks for elaborating. Roaming now. Will respond later

OK, let’s start from scratch again.

This is my rule for checking the certificate and it works for 2 of 3 hosts. Note: I’m not setting any HOSTADDRESS, this must be some magic added by CMK:

This rule is always returning OK on the 2 hosts and from the result page I can see, that HOSTADDRESS is somehow part of the game and I suppose, this will be replaced by the CMK with the address of the host in question automatically, but I don’t set it.

This doesn’t work on the 3rd host and returns the CRTICIAL problem described above.

Now I have another rule, explicitly querying the third host (which doesn’t work in the first query):

This query returns a redirection response, but OK.

It also looks like if it doesn’t make use of the HOSTADDRESS:

OK, meanwhile I found the reason for the test to fail: It is my different NGINX configuration on that third host. NGINX is treating the incoming traffic over 443 as stream in order to be able to serve a web application and another TCP service under the same port 443.

The principle has been adopted from Jitsi (Setting up TURN | Jitsi Meet). It basically ensures to have NGINX and another server (non-HTTP) listening on the same port 443. The input is handled as “stream” and then internally forwarded to the targets by sub-domain discrimination. Very simple and effective. But - basically just works, if the redirection finally hits the proper target. Since a generic call to “ms.badserver.com” doesn’t meet this demand, it must fail.

Solved.

Anyway, we are about to abandon this NGINX configuration at all because of another side effect: Due to the detour over streams the information of the public remote_addr is missing at the webserver (and I didn’t find any way up to now to restore it). So this is no issue at all after abandoning this extra round over NGINX.

EDIT: I could find it by re-establishing this NGINX behaviour on the machines, on which the test initially worked. It failed as bad as on the third machine, once it is in place.

Turn on inline help on the rule page to see the description of the fields/options.
Especially (and as already cited before):

“Usually Checkmk will nail this check to the primary IP address of the host it is attached to. It will use the corresponding IP version (IPv4/IPv6) and default port (80/443).”

Yes. Nothing to say against this. But not my issue. Anyway. Solved

Having now configured a virtual host (the failing host). And admittedly this works, even with the “different” NGINX config. Thanks again for your assistance

1 Like

This topic was automatically closed 365 days after the last reply. New replies are no longer allowed. Contact an admin if you think this should be re-opened.