Hello Folks,
I would like to achieve that some of the services which are retrieved by the CheckMK Agent change their status to Critical when the CheckMK Agent is not able to retrieve the data anymore. In this case the Check_MK status changes to critical but all of his services stay OK and go to stale. Is there a possibility to change the status of those services when they be in stale?
Background:
we have a Dashboard for our customers which displays only their services in which they be interested to see and not necessary all the host and all his services. I’m able to configure in the dashboard to show only CRIT services but not stale as well.
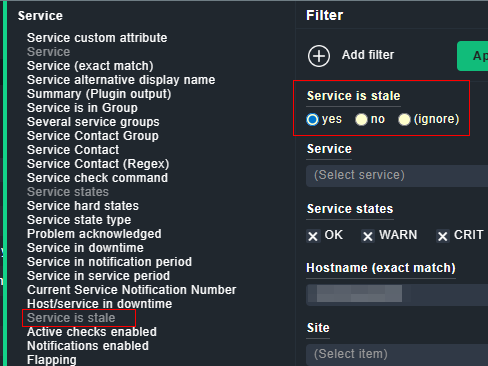
There is an option to show stale services as well. In your dashboard, edit the corresponding element and add a context/search filter for services “service is stale”, set it to ignore.
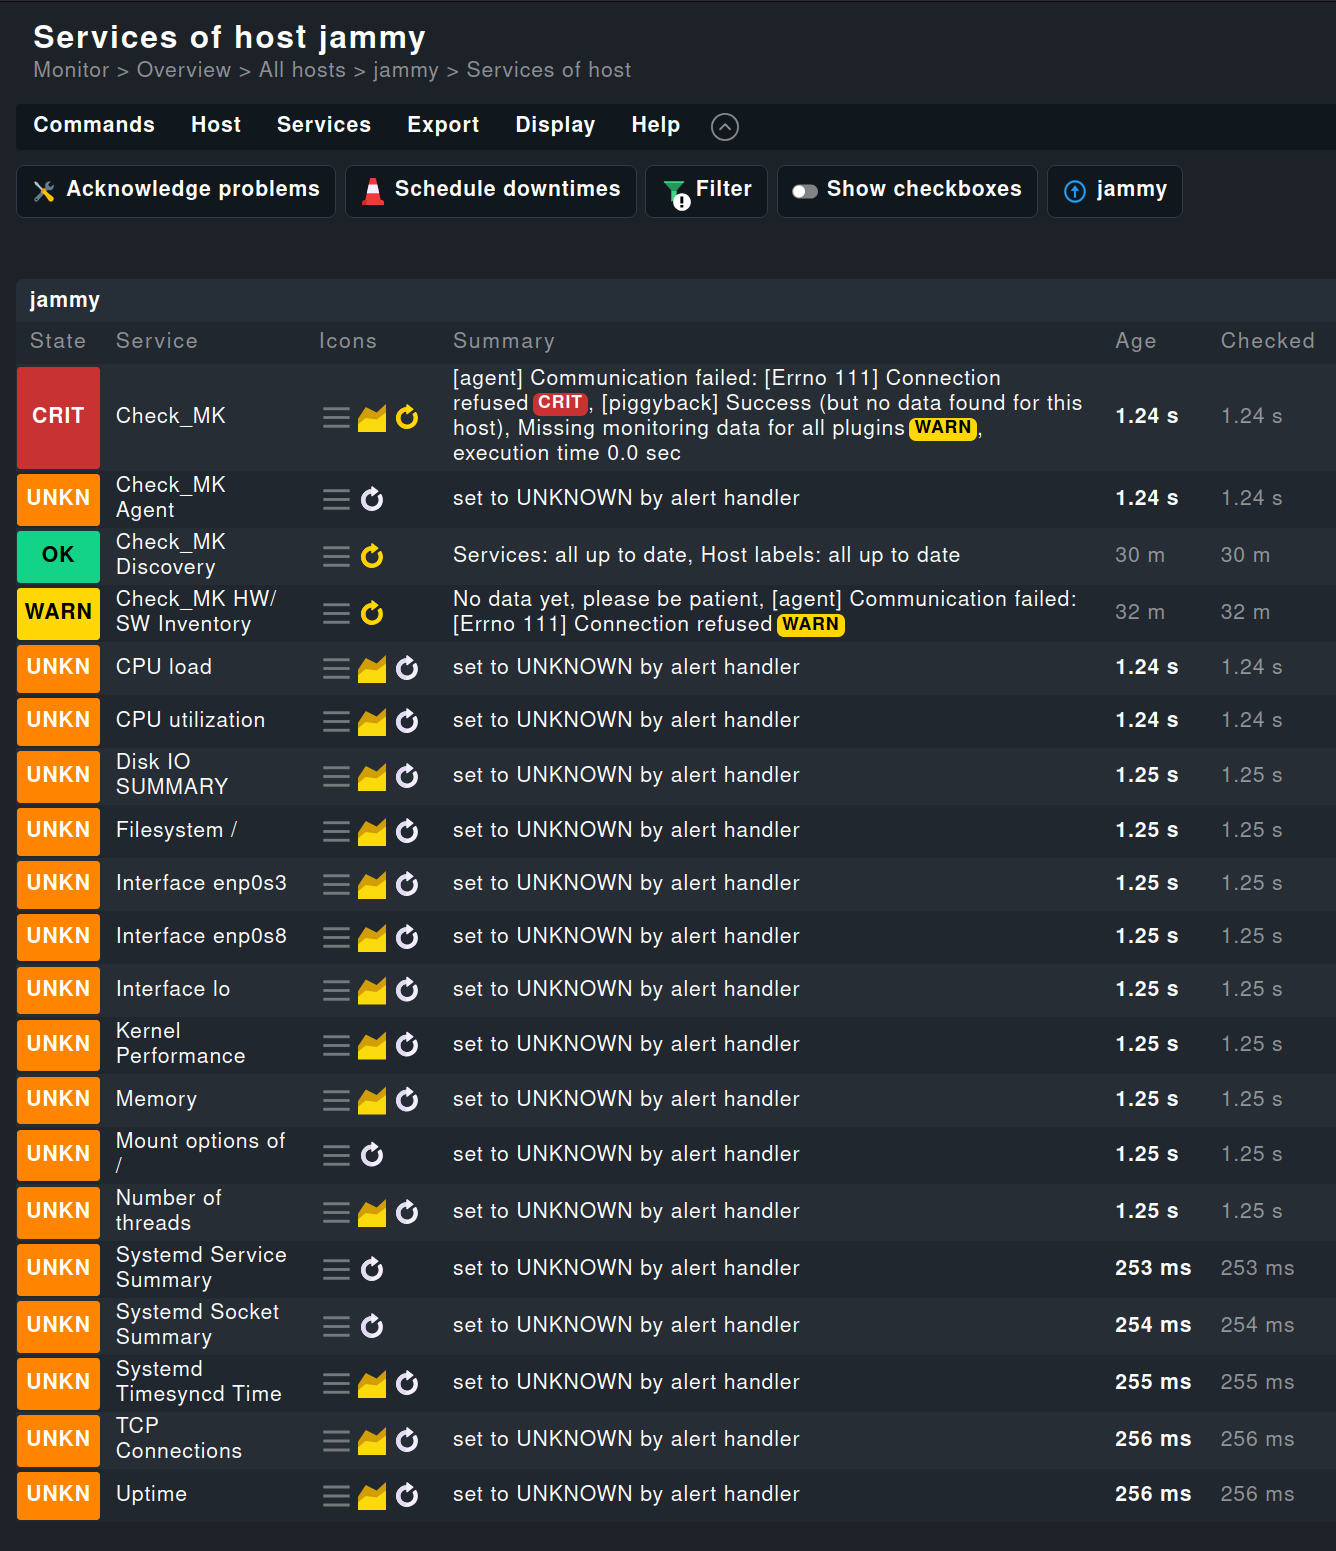
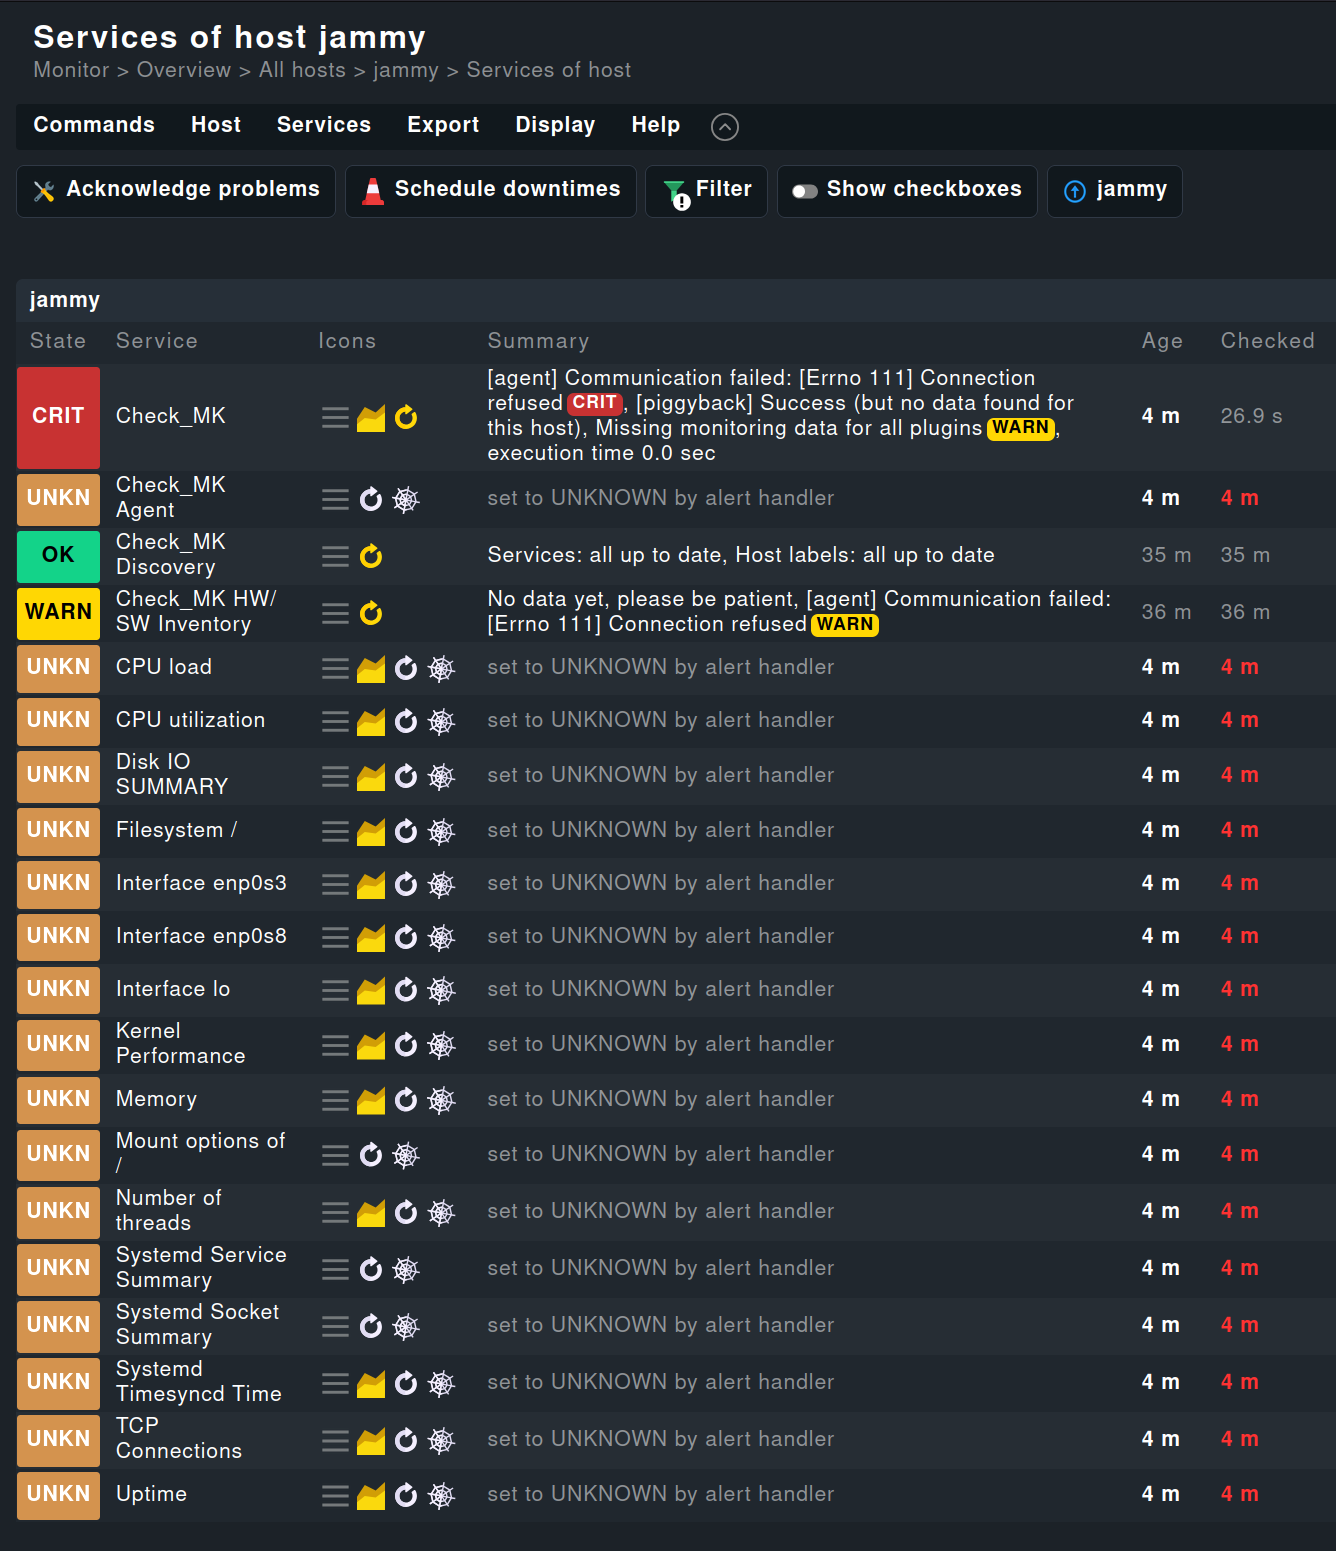
If I fake a CRITICAL check result for the Check_MK service, or disable the agent controller on that host to provoke a CRITICAL Check_MK service all passive checks are set to UNKNOWN:
Hi Janncek,
I have tried it, but when I have a Dashboard with the following setting: Service hard states only “CRIT” and Service Stale to “ignore” I get only the CRIT stale services, but I would like to see all CRIT services and all stale services.
@mimimi
Thank you very much for you afford. As you have mentioned this solution brings many unwanted notifications because of the service state manipulation.
I would like to see in my single dashboard view only CRIT services and only stale services (no matter in which state they are).
I’m missing in the Dashboard Search Filter at Service → Service Hard States → basically a additional stale option.
In all the editions except raw, which I got, there is a rule called Service state translation (also Host state translation) that can make a state change to something else based on conditions. Maybe that rule can help you out to change Stale into Critical.
Since Stale isn’t really a state, but more a ‘modifier’ on an existing state, it might not work. But it doesn’t hurt to try.
Basically you want to combine the results of two different filtered views together. One view with all states with ‘modifier’ Stale set to yes, the other view with the bad states but with Stale set to no (to avoid double entries).
To combine the two views, perhaps Business Intelligence can help.
Thanks for your solution. Indeed its a similar solution to @mimimi. The problem with this solution is: it will potentially produce a good amounts of alerts. So the meaning behind stale is a good intention which I not wanna miss, but I would like to display only stateless Stale Services with Services in State Critical in one view. But I guess its not achievable in one view.
I have now the idea to make a counter for Stale Services. What is the best way to make a counter for filtered services in stale?
I’m open to any idea since my Dashboard skills are not great yet.
If you use the sidebar in your interface, the sidebar element Overview automagically show stale counters when specific stale hosts or services are unhandled (read: not set in downtime or such).
The builtin view named uncheckedsvc shows stale services as a list, which can be found here: Monitor > Problems > Stale services. Same condition as sidebar counter.
Using RAW myself, the dashboard elements are very limited, so my Dashboards skill are not great either. Unable to test specific element, I assume you can use Metric > Single metric and use service Service is stale to get the dashboard counter you seek.
Edit: Thought I could possibly test it out in the Checkmk Playground, but sadly not allowed to setup / customize / edit stuff there.
This topic was automatically closed 365 days after the last reply. New replies are no longer allowed. Contact an admin if you think this should be re-opened.