Hi,
since updating to CEE 1.6.0p11 the time check with chrony is going into stale state.
I have doublechecked that there is no ntp installed - chrony only on Centos 7.x.
Any ideas why I’m getting this error on most of my hosts?
Hi,
since updating to CEE 1.6.0p11 the time check with chrony is going into stale state.
I have doublechecked that there is no ntp installed - chrony only on Centos 7.x.
Any ideas why I’m getting this error on most of my hosts?
Can you take a look at your agent output on your system?
Is the agent also updated to the actual version?
Hi Andreas,
agent is updated to 1.6.0p11 latest.
The output is
<<chrony:cached(1586946575,30)>>
Reference ID : 59EA404D (89.234.64.77)
Stratum : 3
Ref time (UTC) : Wed Apr 15 10:27:12 2020
System time : 0.000278031 seconds slow of NTP time
Last offset : -0.000086032 seconds
RMS offset : 0.000207073 seconds
Frequency : 26.163 ppm fast
Residual freq : -0.005 ppm
Skew : 0.126 ppm
Root delay : 0.021480082 seconds
Root dispersion : 0.005031839 seconds
Update interval : 1043.9 seconds
Leap status : Normal
Same host from the gui
The next step is then
cmk --debug -vv yourhostname
You should see an chrony NTP check or some error message.
Hi,
no error…
NTP Time OK - Stratum: 3, Offset: 0.4600 ms, Reference ID: 59EA404D (89.234.64.77)
That’s the same I can see in the gui but the check is in stale state… 
Strange behaviour… after issuing the command on the cli the check is recovered from stale state… I guess after some time it goes back to stale…
Do a “cmk --debug -vvII yourhost” and “cmk -R”
If then the check stays stale i cannot help anymore.
cmk --debug -vvll gives me:
chrony is there…
Hm… I have seen that we have a few more services are in stale state because of caching… Any hints on that - can I configure caching behaviour?
It’s a problem since we upgraded to CEE I guess… hm…
Could this still be a problem?
https://checkmk.com/check_mk-werks.php?werk_id=8261
Related to the discovery service…
I don’t think so as this is a very old issue.
Now the service stays stale? Is is not refreshed if you da a “cmk yourhost” on the command line?
no - still stale - they go away afer doing that, but after minutes… again they are stale. Most of them are ntp (~ 70 hosts), some of them are azure related.
all of them are cache related as it seems… ~90 - 120 services (of total 11k) are in stale state
On the host with the NTP problem there is also nothing written inside the “Check_MK” service about missing agent section or?
no… section is there.
I don’t know anymore what this could be. The version p11 is ok the stale problem was until p10.
And only with active checks 
Only point left
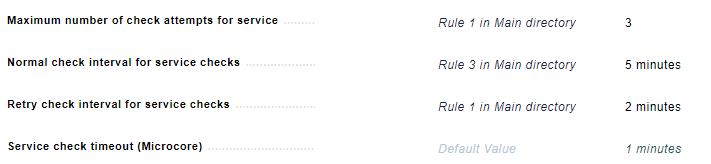
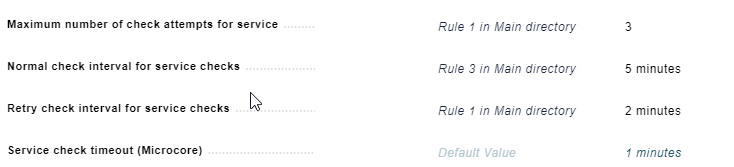
Look at the “Parameters for this service” and there at the “Monitoring Configuration” section.
Compare this section with the “Parameters for this service” of the “Check_MK” service.
Is this all the same?
Hi Andreas!
For the Timeservice:
Service “Check_MK”
But both settings are “old” ones from the RAW edition. I had a similar problem
with AWS checks… Settings from the RAW didn’t work very well with CEE. Reverted
to standard, AWS is working fine now.
Regards
Günther
hm… did a test… reset of “normal check interval” back to default (1 Minute…). Stale status is gone as it seems - will do an update tomorrow if it is still better now…
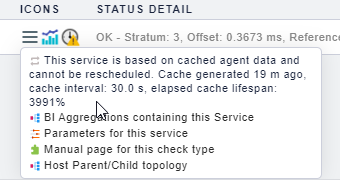
Das Problem hier ist - der NTP ist ein Check welcher auf der Agent Seite gecached wird. Aber nur mit 30 Sekunden.
Damit ist der Check bei jedem Abfrageintervall (5min) schon wieder invalide und wird gar nicht verarbeitet.
Ich wüsste jetzt aus dem Kopf auch keine Einstellung mit der man das verändern kann.
Einfach den Normal Check Interval immer auf einer Minute lassen passt
Ich verstelle dies wirklich nur in Ausnahmefällen.
Hi Andreas,
kann ich jetzt nachvollziehen. War in der RAW-Edition nie ein Problem, jetzt erst mit der CEE
sind da einige Dinge anders. Die Auslastung des Servers bei 12k Services ist natürlich jetzt
ungleich höher - aber es scheint jetzt tatsächlich zu funktionieren.
Thx for your help!
Günther
This topic was automatically closed 30 days after the last reply. New replies are no longer allowed.