You could try lsof -p <PID> and try to see what it’s doing.
Here is the output. I‘m wondering why systemd is listening on port 6556 on IPv6? Shouldn‘t that be done from xinetd?
COMMAND PID USER   FD      TYPE             DEVICE SIZE/OFF       NODE NAME
systemd   1 root  cwd       DIR                8,1     4096          2 /
systemd   1 root  rtd       DIR                8,1     4096          2 /
systemd   1 root  txt       REG                8,1  1739200     396983 /usr/lib/systemd/systemd
systemd   1 root  mem       REG                8,1   149576     397152 /usr/lib/x86_64-linux-gnu/libgpg-error.so.0.29.0
systemd   1 root  mem       REG                8,1  3076960     395736 /usr/lib/x86_64-linux-gnu/libcrypto.so.1.1
systemd   1 root  mem       REG                8,1    26984     393551 /usr/lib/x86_64-linux-gnu/libcap-ng.so.0.0.0
systemd   1 root  mem       REG                8,1   617128     397608 /usr/lib/x86_64-linux-gnu/libpcre2-8.so.0.10.1
systemd   1 root  mem       REG                8,1   149520     394670 /usr/lib/x86_64-linux-gnu/libpthread-2.31.so
systemd   1 root  mem       REG                8,1    18688     394659 /usr/lib/x86_64-linux-gnu/libdl-2.31.so
systemd   1 root  mem       REG                8,1   158400     398003 /usr/lib/x86_64-linux-gnu/liblzma.so.5.2.5
systemd   1 root  mem       REG                8,1   890800     399431 /usr/lib/x86_64-linux-gnu/libzstd.so.1.4.8
systemd   1 root  mem       REG                8,1   137568     394172 /usr/lib/x86_64-linux-gnu/liblz4.so.1.9.3
systemd   1 root  mem       REG                8,1    35280     393740 /usr/lib/x86_64-linux-gnu/libip4tc.so.2.0.0
systemd   1 root  mem       REG                8,1  1176248     397239 /usr/lib/x86_64-linux-gnu/libgcrypt.so.20.2.8
systemd   1 root  mem       REG                8,1   202680     394648 /usr/lib/x86_64-linux-gnu/libcrypt.so.1.1.0
systemd   1 root  mem       REG                8,1    38864     394213 /usr/lib/x86_64-linux-gnu/libcap.so.2.44
systemd   1 root  mem       REG                8,1   326624     394781 /usr/lib/x86_64-linux-gnu/libblkid.so.1.1.0
systemd   1 root  mem       REG                8,1    38936     394931 /usr/lib/x86_64-linux-gnu/libacl.so.1.1.2253
systemd   1 root  mem       REG                8,1  1839792     394658 /usr/lib/x86_64-linux-gnu/libc-2.31.so
systemd   1 root  mem       REG                8,1    76480     395336 /usr/lib/x86_64-linux-gnu/libapparmor.so.1.6.3
systemd   1 root  mem       REG                8,1   108592     398721 /usr/lib/x86_64-linux-gnu/libkmod.so.2.3.6
systemd   1 root  mem       REG                8,1   128952     393557 /usr/lib/x86_64-linux-gnu/libaudit.so.1.0.0
systemd   1 root  mem       REG                8,1    67584     395960 /usr/lib/x86_64-linux-gnu/libpam.so.0.85.1
systemd   1 root  mem       REG                8,1   375424     394792 /usr/lib/x86_64-linux-gnu/libmount.so.1.1.0
systemd   1 root  mem       REG                8,1   166120     398475 /usr/lib/x86_64-linux-gnu/libselinux.so.1
systemd   1 root  mem       REG                8,1   137536     394072 /usr/lib/x86_64-linux-gnu/libseccomp.so.2.5.1
systemd   1 root  mem       REG                8,1    39912     394672 /usr/lib/x86_64-linux-gnu/librt-2.31.so
systemd   1 root  mem       REG                8,1  2692512     396805 /usr/lib/systemd/libsystemd-shared-247.so
systemd   1 root  mem       REG                8,1   177928     394654 /usr/lib/x86_64-linux-gnu/ld-2.31.so
systemd   1 root    0u      CHR                1,3      0t0          4 /dev/null
systemd   1 root    1u      CHR                1,3      0t0          4 /dev/null
systemd   1 root    2u      CHR                1,3      0t0          4 /dev/null
systemd   1 root    3w      CHR               1,11      0t0         10 /dev/kmsg
systemd   1 root    4u  a_inode               0,13        0       9074 [eventpoll]
systemd   1 root    5u  a_inode               0,13        0       9074 [signalfd]
systemd   1 root    6r  a_inode               0,13        0       9074 inotify
systemd   1 root    7r      DIR               0,25        0          1 /sys/fs/cgroup
systemd   1 root    8u  a_inode               0,13        0       9074 [timerfd]
systemd   1 root    9u  a_inode               0,13        0       9074 [eventpoll]
systemd   1 root   10r      REG               0,20        0        175 /proc/1/mountinfo
systemd   1 root   11r  a_inode               0,13        0       9074 inotify
systemd   1 root   13r  a_inode               0,13        0       9074 inotify
systemd   1 root   14r      REG               0,20        0 4026532069 /proc/swaps
systemd   1 root   15u  netlink                         0t0        176 KOBJECT_UEVENT
systemd   1 root   16u     unix 0x000000008c430a9f      0t0        177 /run/systemd/notify type=DGRAM
systemd   1 root   17u     unix 0x000000008a9695fd      0t0        178 type=DGRAM
systemd   1 root   18u     unix 0x000000005c8c7057      0t0        179 type=DGRAM
systemd   1 root   19u     unix 0x000000007ec1114e      0t0        180 /run/systemd/private type=STREAM
systemd   1 root   20u     unix 0x000000001f0fb1f3      0t0        182 /run/systemd/userdb/io.systemd.DynamicUser type=STREAM
systemd   1 root   21u     unix 0x00000000fc6e71a2      0t0        183 /run/systemd/io.system.ManagedOOM type=STREAM
systemd   1 root   25u     unix 0x00000000059d3cc8      0t0     683267 /run/systemd/journal/stdout type=STREAM
systemd   1 root   26r  a_inode               0,13        0       9074 inotify
systemd   1 root   27r  a_inode               0,13        0       9074 inotify
systemd   1 root   28r      CHR             10,235      0t0        235 /dev/autofs
systemd   1 root   29r     FIFO               0,12      0t0        190 pipe
systemd   1 root   30u  a_inode               0,13        0       9074 [timerfd]
systemd   1 root   31u     unix 0x00000000029c4251      0t0        193 /run/systemd/journal/syslog type=DGRAM
systemd   1 root   32u     unix 0x00000000a5ee56e4      0t0        195 /run/systemd/fsck.progress type=STREAM
systemd   1 root   33u     FIFO               0,22      0t0        247 /run/initctl
systemd   1 root   34u  netlink                         0t0        198 AUDIT
systemd   1 root   35u     unix 0x00000000eee88933      0t0        199 /run/systemd/journal/dev-log type=DGRAM
systemd   1 root   36u     unix 0x000000002b72fe33      0t0        201 /run/systemd/journal/socket type=DGRAM
systemd   1 root   37u     unix 0x00000000c7d322c2      0t0        203 /run/systemd/journal/stdout type=STREAM
systemd   1 root   38u     unix 0x00000000bb07841c      0t0        205 /run/udev/control type=SEQPACKET
systemd   1 root   39u  netlink                         0t0        207 KOBJECT_UEVENT
systemd   1 root   40u  a_inode               0,13        0       9074 bpf-prog
systemd   1 root   41u  a_inode               0,13        0       9074 bpf-prog
systemd   1 root   42u  a_inode               0,13        0       9074 bpf-prog
systemd   1 root   43u  netlink                         0t0        253 AUDIT
systemd   1 root   44u  a_inode               0,13        0       9074 bpf-prog
systemd   1 root   45u  a_inode               0,13        0       9074 bpf-prog
systemd   1 root   46u  a_inode               0,13        0       9074 bpf-prog
systemd   1 root   47u     unix 0x00000000b01391ba      0t0        352 type=DGRAM
systemd   1 root   48u  a_inode               0,13        0       9074 bpf-prog
systemd   1 root   49u     unix 0x00000000f1ff1fb3      0t0      12271 /run/systemd/journal/stdout type=STREAM
systemd   1 root   50u     unix 0x000000000e4aac5f      0t0        746 /run/systemd/journal/stdout type=STREAM
systemd   1 root   51u     unix 0x0000000007ea1bb1      0t0        383 /run/systemd/journal/stdout type=STREAM
systemd   1 root   52u  a_inode               0,13        0       9074 [timerfd]
systemd   1 root   53u     unix 0x000000009f91d42b      0t0      11762 /run/dbus/system_bus_socket type=STREAM
systemd   1 root   54u     IPv6              11761      0t0        TCP *:6556 (LISTEN)
systemd   1 root   55u     unix 0x000000000eef3013      0t0      11732 /run/systemd/journal/stdout type=STREAM
systemd   1 root   56u     unix 0x00000000c5b3389e      0t0      11764 /run/pcscd/pcscd.comm type=STREAM
systemd   1 root   57u     unix 0x00000000391f8838      0t0      11773 type=STREAM
systemd   1 root   58u  a_inode               0,13        0       9074 bpf-prog
systemd   1 root   59u     unix 0x00000000d386092b      0t0      11863 /run/systemd/journal/stdout type=STREAM
systemd   1 root   60u  a_inode               0,13        0       9074 bpf-prog
systemd   1 root   61u  a_inode               0,13        0       9074 bpf-prog
systemd   1 root   62u  a_inode               0,13        0       9074 bpf-prog
systemd   1 root   63u     unix 0x00000000b2e4cbed      0t0      11774 /run/systemd/journal/stdout type=STREAM
systemd   1 root   64u     unix 0x00000000cea4b78a      0t0      11775 /run/systemd/journal/stdout type=STREAM
systemd   1 root   66u     unix 0x000000005f9816cc      0t0      11798 /run/systemd/journal/stdout type=STREAM
systemd   1 root   67u     unix 0x00000000778d1f62      0t0        682 /run/systemd/journal/stdout type=STREAM
systemd   1 root   69u     unix 0x0000000078a77f81      0t0        769 /run/systemd/journal/stdout type=STREAM
systemd   1 root   71u     unix 0x000000009cde92c8      0t0        756 /run/systemd/journal/stdout type=STREAM
Hey @drBeam
Hmm… I find those netlink AUDIT entries weird… Apparently Debian (but other distributions, too… never occurred to me on CentOS though) have somehow a systemd-journald-audit.socket and people have already complained about it and filed a pull request to have it disabled, look here:
Can you check whether you have this socket and/or auditd installed? I’d remove the latter, unless you need it, and I’d probably try to disable the former and reboot (just to be sure).
EDIT In case my previous sentence is ambiguous: You should reboot when you remove auditd, too.
Might that be your issue?
Regards,
Thomas
Hi Thomas,
i checked and none of those things is installed on the system. Only libaudit1 and i think its a bad idea to uninstall this ![]()
I think i will try a CentOS installation and see if the Check_MK Agent is causing the same problems there…
Is there any new information on this? We have several systems with many small VMs that we monitor with cmk.
The problem with this is that this kills basically smaller installation with low-budget server systems which now require high end DC NVMEs to handle the IO load since all systems running the cmk agents are constantly causing them. Good luck explaining this to a customer, because it worked all those years without issues. And suddenly they are supposed to spend a lot more on the storage devices for monitoring applications?!
Additionally this is causing unnecessary IO on network storage systems putting it under higher load for no real reason.
When stopping the check_mk* services the IO drops to almost zero. Attached is a screenshot from the hypervisor (proxmox) vm disk IO stats.
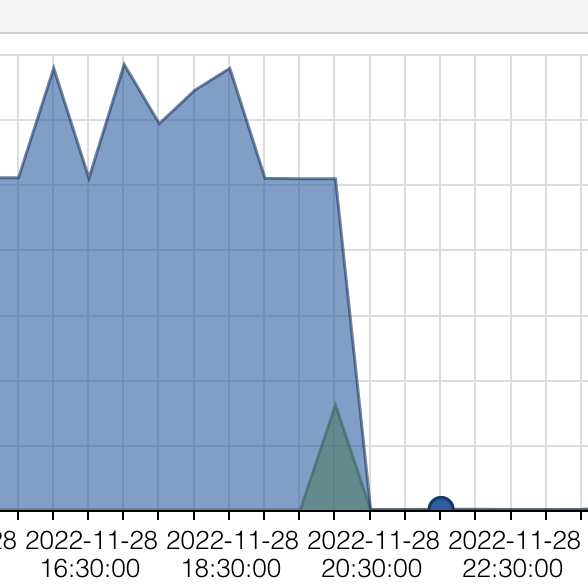
How do we go from here? ![]()
You could try to to stop the agent service and launch the agent script a few times manually (/usr/bin/check_mk_agent).
Just to see if it’s the agent itself that is causing the I/O issues or if it’s caused by systemd launching the agent.
1 Like
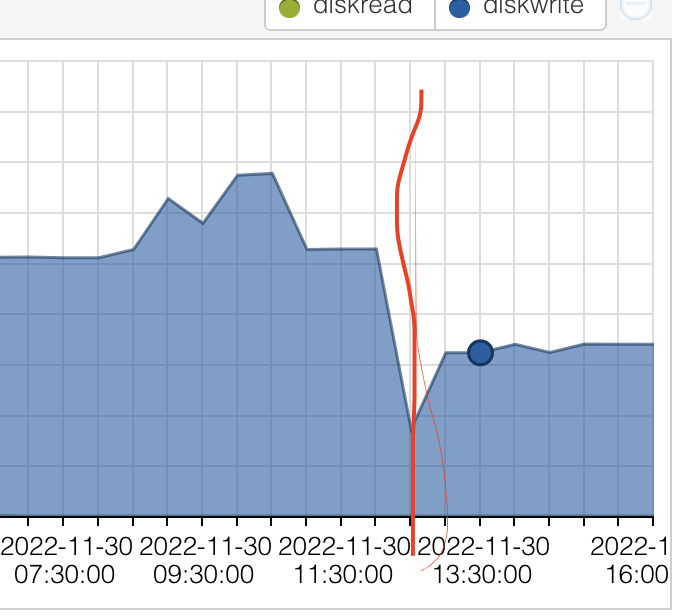
Interessting. Before the line is check_mk running with systemd. After the line is check_mk running with ‘watch -n 60’. Hence it seems both are causing some serious IO but cmk itself most of it.
There’s no legend in the graph showing how much is actually written to disk, but in the end it has to go somewhere on the disk.
Maybe you could figure out if there’s some files/folders growing rapidly over time, while the agent is running, but not when it’s stopped. My best guess would be to look at /var/log first.
Yeah, that’s my bad.
High line was at about 6,5 MB/s and the lower at 3,2 MB/s.
/usr/bin/check_mk_agent > /dev/null → Hence nothing is written locally by the command itself.
The syslog only writes 3 lines when cmk is executed every minute.
Stopping the watch loop brings down the idle IO to almost zero again as previously posted.
BTW the agent version is 2.1*
The systemd I/O problem was fixed end of May with version 2.1.0p1 or p2-
If your proxmox graph shows such a high I/O, how long is the runtime of a single agent run?
Also here the question how is the agent executed - systemd/xinetd/ssh?
In my very small proxmox setup i have no such problem - nearly no disk I/O at all.
Between 0,5 and 1 MB/s on the proxmox hosts with 4-6 containers/VMs and all are monitored with CMK agent. Data between booth is synced over ZFS.
Good to know. Maybe the newer version of the agent .deb package didn’t remove older configuration properly? We’re using an older version of the official ansible roles that we somewhat fixed in 2020/2021 to work in our env.
Normal operation with systemd. Testing currently in a tmux session with watch -n 60 (local ssh).
Thanks for confirming something is not right. I’ll completely remove all cmk agent files and install the latest agent manually via the .deb package.
We have the issue currently on PVE with local ZFS, local LVM-Thin and Ceph storage. But I suspect something wrong with the agent setup then.
If you have any more hints we should have a look for that would be great.
The IO issue is still present after purging the agent, marking sure that all old config files are gone from the vm and rebooting multiple times in between.
The long break in between were a couple of days were I had stopped the agent. Didn’t find time to look at the issue until today.
It seems that after running 2.1.0p17 with enabled TLS the IO issue is even worse.
Currently I am out of ideas.
check_mk_agent runtime of on this server:
real    0m2.701s
user    0m1.856s
sys     0m0.266s
Edit: We have the APT plugin usually running. I removed that to see if that might be the cause.
real    0m0.608s
user    0m0.253s
sys     0m0.056s
Pulling the APT plugin once an hour with the async config might help here. It doesn’t really have to run every time the agent is pulled.
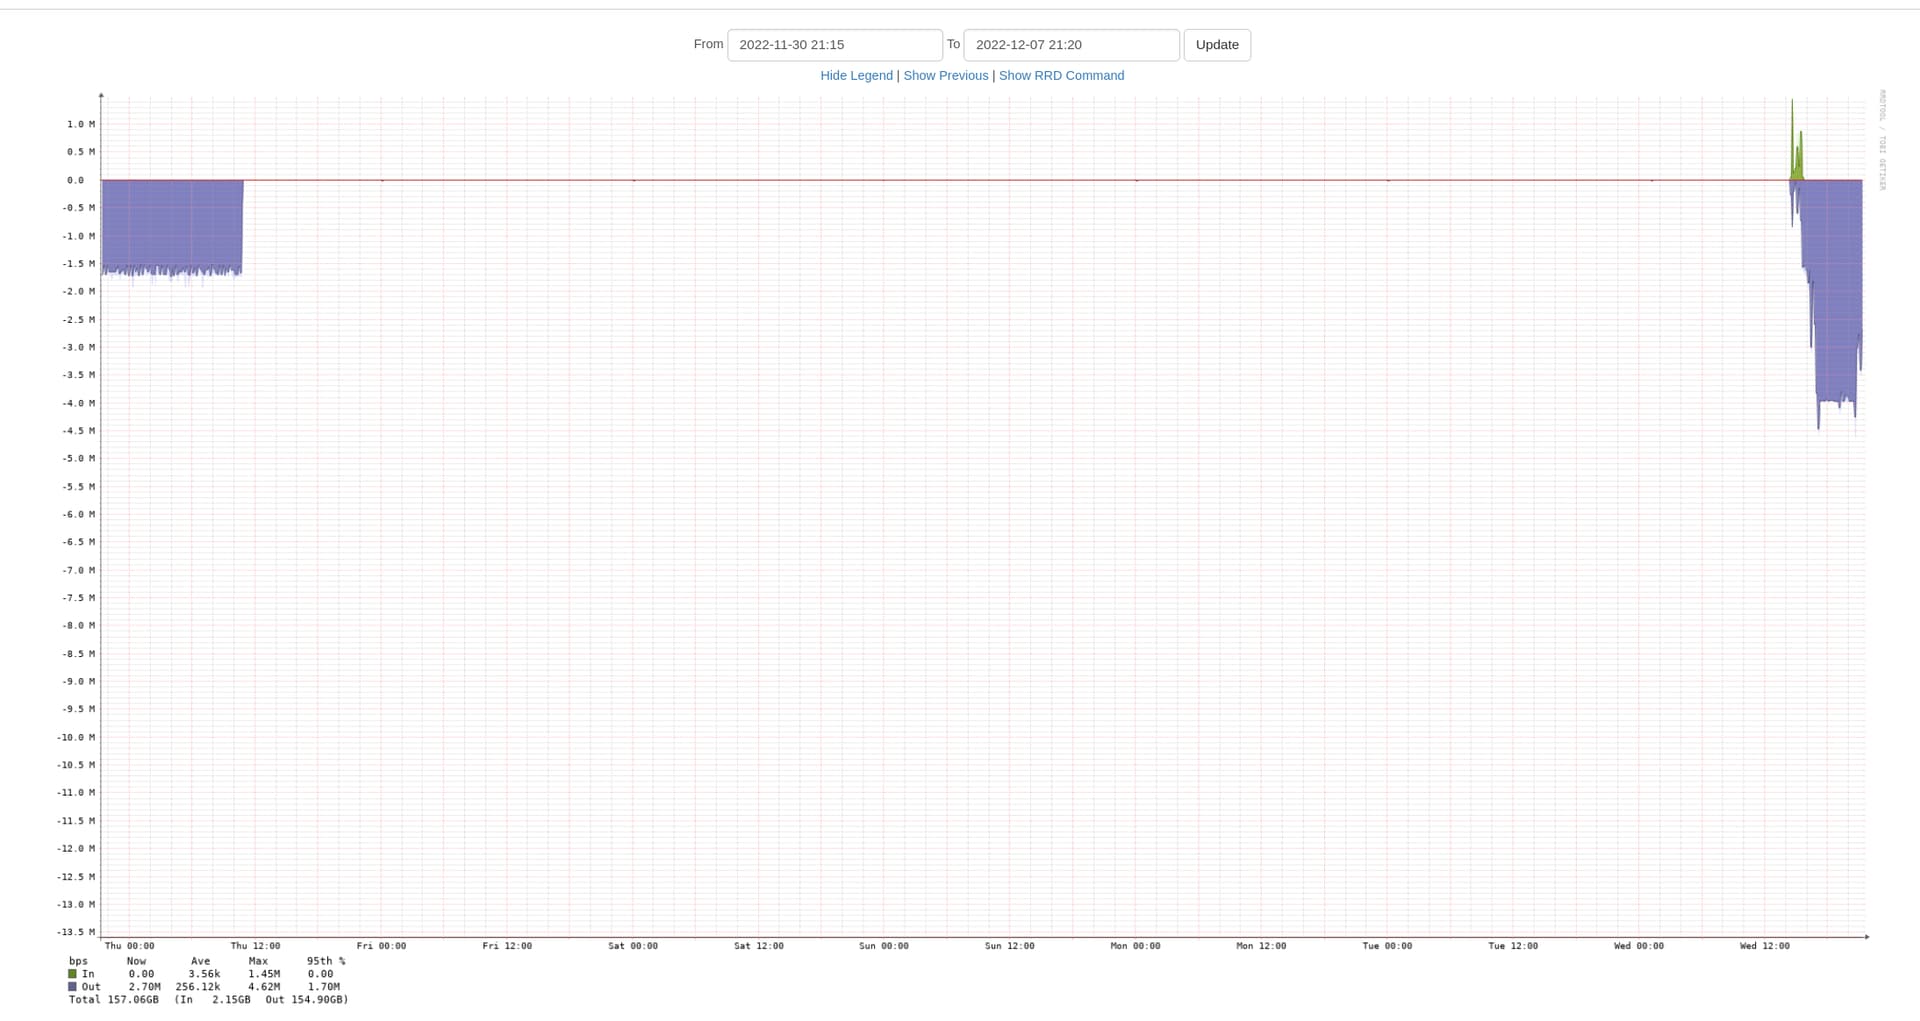
Even after changing the APT plugin to async (every 900 sec) the IO is still at 1.5MB/s according to PVE.
Here is a graph from one PVE node. The writes per VMs are totally off.
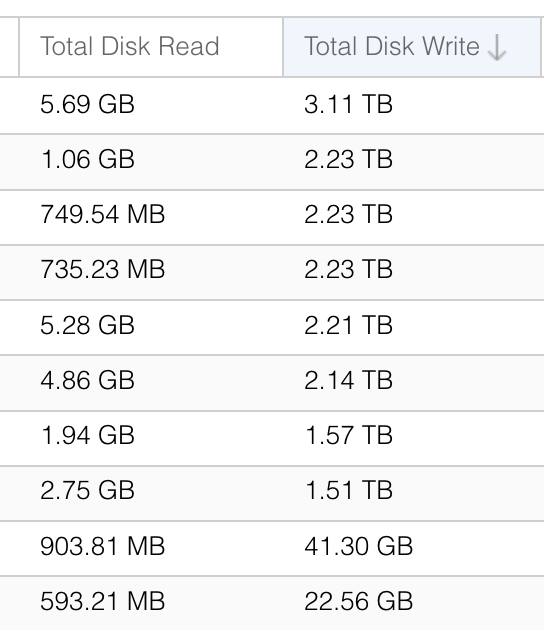
The last 2 VMs are only that low because we just enabled cmk monitoring yesterday around 22h.
Currently I am out of ideas. :-/
Take one of your machines as example, and disable most section of the agent.
The 2.1 agent supports this feature what is like on the windows agent.
Example cfg file can be found here.
If you see that there is no write with some sections disabled, you can enable the sections one by one to find the problematic one.
But if I look at my environments, I think that there is some other problem on your system.
1 Like
Thanks for the information. Didn’t know that one yet.
Looking into that I think that this is related to the APT updates agent plugin provided by check_mk. Even with async it causes a disk IO spike.
Interestingly enough the script from LibreNMS that extends the SNMP run doesn’t create anything close to that high IO. So what is so different with the check_mk approach?
LibreNMS script for apt updates:
https://raw.githubusercontent.com/librenms/librenms-agent/master/snmp/osupdate
CheckMK info page for apt updates check plugin:
Every time the cmk apt plugin is run by the agent the disk spikes. Is this related to the cmk cache the info pages talsk about?
Why doesn’t the LibreNMS script cause anything close to this?
The mk_apt agent plugin is rather simple. In it’s default configuration, it basically does (some options skipped):
apt-get update
apt-get -s upgrade
The first step updates the package lists from the Debian/Ubuntu mirrors. The lists can be quite big, depending on the contents of your sources.list.
Looking at the LibreNMS script it doesn’t seem that much different. But somehow it is since it doesn’t cause that much IO.
Maybe we can adjust the LibrenMS script to work with check_mk and output the apt data in a way it requires it.
Maybe someone knows already how the check_mk_agent expects the apt data to be exported.
I doubt that you can reduce the disk IO by that, as the mk_apt script is already very minimal.
The crucial point is the first command, apt-get update. When you set the DO_UPDATE variable from yes to no, this step is skipped in the plugin. However, you need to update the packages lists from time to time, e.g. in /etc/cron.daily.
You can see the required format by simply executing the mk_apt script manually.
if you have now successfully managed to identify the cause of the problem, my question is - how often do you need to check that new apt updates are available ?
I would just set the cache age for that plugin to 24 hours and boom - minimized the io load for that plugin to 1/86400 ![]()
2 Likes
Currently I set it to once an hour. The IO changed a lot already. I might increase this number in future though.
I am wondering though why the plugin itself does the update every time it’s called. It should have a default var that automatically only checks for updates once an hour or something like that.
I didn’t even think of the apt plugin in the first place because it didn’t make sense to me to check every few seconds/once a min for new updates. And I don’t know any other monitoring solution that does it this way. Hence my ref to the librenms apt script.