after long troubleshooting i found the issue that causes my VMs to have high disk writes (about 1MB/s) all the time: it’s the Check_MK agent?!
I found out that if i shutdown the Check_MK Docker Container the Disk IO falls down to some KB/s on all VMs that are monitored. If i start the Check_MK container again, the disk IO comes back on all VMs that are monitored. Even VMs that are hosted in the cloud have this behaviour. What the hell is this and how can i stop this from happening?
The Checkmk Agent itself normally does not write much data to disk, just some small files under /var/lib/check_mk_agent.
But you should check you syslog entries. Especially if you use auditd, apparmor or selinux, it is possible that each command invocation from the agent is logged. In standard syslog configurations, each line will be written synchronously, which can easily sum up to a high write rate.
I checked the syslog and i can’t find anything special. Yes, every time the agent runs there is a log entry, but this does not explain the high writes.
Feb 25 08:45:54 vpn-01 systemd[1]: Starting Check_MK (10.0.1.3:33080)...
Feb 25 08:45:56 vpn-01 systemd[1]: check_mk@33-10.0.1.16:6556-10.0.1.3:33080.service: Succeeded.
Feb 25 08:45:56 vpn-01 systemd[1]: Started Check_MK (10.0.1.3:33080).
Feb 25 08:45:56 vpn-01 systemd[1]: check_mk@33-10.0.1.16:6556-10.0.1.3:33080.service: Consumed 1.666s CPU time.
Feb 25 08:46:54 vpn-01 systemd[1]: Starting Check_MK (10.0.1.3:33602)...
Feb 25 08:46:56 vpn-01 systemd[1]: check_mk@34-10.0.1.16:6556-10.0.1.3:33602.service: Succeeded.
Feb 25 08:46:56 vpn-01 systemd[1]: Started Check_MK (10.0.1.3:33602).
Feb 25 08:46:56 vpn-01 systemd[1]: check_mk@34-10.0.1.16:6556-10.0.1.3:33602.service: Consumed 1.590s CPU time.
Feb 25 08:47:54 vpn-01 systemd[1]: Starting Check_MK (10.0.1.3:34130)...
Feb 25 08:47:56 vpn-01 systemd[1]: check_mk@35-10.0.1.16:6556-10.0.1.3:34130.service: Succeeded.
Feb 25 08:47:56 vpn-01 systemd[1]: Started Check_MK (10.0.1.3:34130).
Feb 25 08:47:56 vpn-01 systemd[1]: check_mk@35-10.0.1.16:6556-10.0.1.3:34130.service: Consumed 1.582s CPU time.
Feb 25 08:48:54 vpn-01 systemd[1]: Starting Check_MK (10.0.1.3:34650)...
Feb 25 08:48:56 vpn-01 systemd[1]: check_mk@36-10.0.1.16:6556-10.0.1.3:34650.service: Succeeded.
Feb 25 08:48:56 vpn-01 systemd[1]: Started Check_MK (10.0.1.3:34650).
Feb 25 08:48:56 vpn-01 systemd[1]: check_mk@36-10.0.1.16:6556-10.0.1.3:34650.service: Consumed 1.784s CPU time.
Feb 25 08:49:54 vpn-01 systemd[1]: Starting Check_MK (10.0.1.3:35180)...
Feb 25 08:49:56 vpn-01 systemd[1]: check_mk@37-10.0.1.16:6556-10.0.1.3:35180.service: Succeeded.
Feb 25 08:49:56 vpn-01 systemd[1]: Started Check_MK (10.0.1.3:35180).
Feb 25 08:49:56 vpn-01 systemd[1]: check_mk@37-10.0.1.16:6556-10.0.1.3:35180.service: Consumed 1.612s CPU time.
Feb 25 08:50:54 vpn-01 systemd[1]: Starting Check_MK (10.0.1.3:35700)...
Feb 25 08:50:56 vpn-01 systemd[1]: check_mk@38-10.0.1.16:6556-10.0.1.3:35700.service: Succeeded.
Feb 25 08:50:56 vpn-01 systemd[1]: Started Check_MK (10.0.1.3:35700).
Feb 25 08:50:56 vpn-01 systemd[1]: check_mk@38-10.0.1.16:6556-10.0.1.3:35700.service: Consumed 1.551s CPU time.
Feb 25 08:51:54 vpn-01 systemd[1]: Starting Check_MK (10.0.1.3:36226)...
Feb 25 08:51:56 vpn-01 systemd[1]: check_mk@39-10.0.1.16:6556-10.0.1.3:36226.service: Succeeded.
Feb 25 08:51:56 vpn-01 systemd[1]: Started Check_MK (10.0.1.3:36226).
Feb 25 08:51:56 vpn-01 systemd[1]: check_mk@39-10.0.1.16:6556-10.0.1.3:36226.service: Consumed 1.605s CPU time.
Feb 25 08:52:54 vpn-01 systemd[1]: Starting Check_MK (10.0.1.3:36764)...
Feb 25 08:52:56 vpn-01 systemd[1]: check_mk@40-10.0.1.16:6556-10.0.1.3:36764.service: Succeeded.
Feb 25 08:52:56 vpn-01 systemd[1]: Started Check_MK (10.0.1.3:36764).
Feb 25 08:52:56 vpn-01 systemd[1]: check_mk@40-10.0.1.16:6556-10.0.1.3:36764.service: Consumed 1.650s CPU time.
Feb 25 08:53:54 vpn-01 systemd[1]: Starting Check_MK (10.0.1.3:37294)...
Feb 25 08:53:56 vpn-01 systemd[1]: check_mk@41-10.0.1.16:6556-10.0.1.3:37294.service: Succeeded.
Feb 25 08:53:56 vpn-01 systemd[1]: Started Check_MK (10.0.1.3:37294).
Feb 25 08:53:56 vpn-01 systemd[1]: check_mk@41-10.0.1.16:6556-10.0.1.3:37294.service: Consumed 1.542s CPU time.
Feb 25 08:54:54 vpn-01 systemd[1]: Starting Check_MK (10.0.1.3:37814)...
Feb 25 08:54:56 vpn-01 systemd[1]: check_mk@42-10.0.1.16:6556-10.0.1.3:37814.service: Succeeded.
Feb 25 08:54:56 vpn-01 systemd[1]: Started Check_MK (10.0.1.3:37814).
Feb 25 08:54:56 vpn-01 systemd[1]: check_mk@42-10.0.1.16:6556-10.0.1.3:37814.service: Consumed 1.579s CPU time.
Feb 25 08:55:01 vpn-01 CRON[19557]: (root) CMD (command -v debian-sa1 > /dev/null && debian-sa1 1 1)
Feb 25 08:55:54 vpn-01 systemd[1]: Starting Check_MK (10.0.1.3:38342)...
Feb 25 08:55:56 vpn-01 systemd[1]: check_mk@43-10.0.1.16:6556-10.0.1.3:38342.service: Succeeded.
Feb 25 08:55:56 vpn-01 systemd[1]: Started Check_MK (10.0.1.3:38342).
Feb 25 08:55:56 vpn-01 systemd[1]: check_mk@43-10.0.1.16:6556-10.0.1.3:38342.service: Consumed 1.601s CPU time.
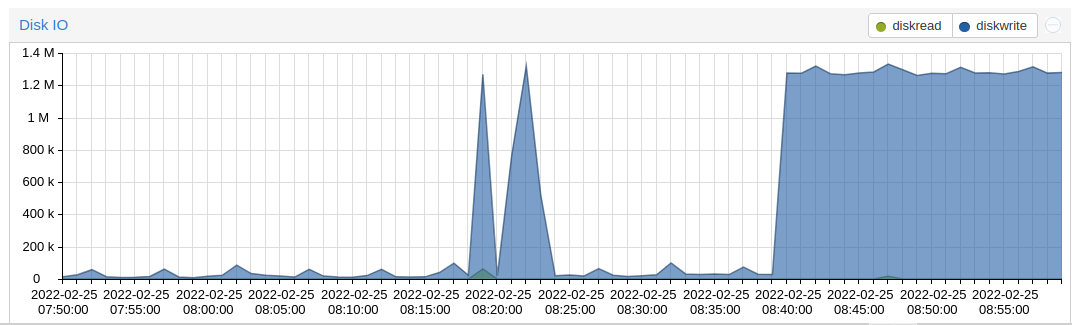
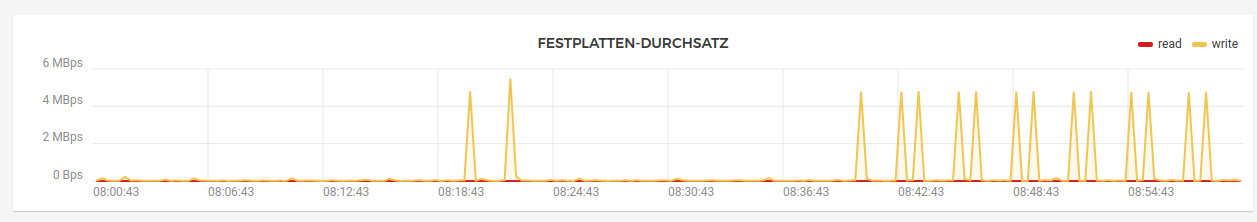
Here are some screenshots when the Check_MK Server is running and when it is stopped.
You could use the command line program pidstat and look for the process generating the io on our system. pidstat can be called in a frequency and you may want to filter the output and condense it.
pidstat -d | sort -r -k4 | head -n20
Sort after the io reads (key 4, key 5 is writes) and give you the highest 20 values. wrap it in watch and you may find your process causing the issue.
Some I/O is definitely ok, but the rates of 1-2MB/s write on a more or less idle machine is a bit much.
Just to make sure we are talking about the same thing:
The screenshots are taken from my VPN and a second mail server. Both machines run the Agent to report their stuff to the Check_MK server. As soon as i stop the Check_MK server, the writes on the machines with the Check_MK Agent fall to ~50KB/s. This issue is not only on the machine that is running the Check_MK Server.
What is your agent doing and which plugins (especially HW/SW inventory, cached plugins) have you enabled? How big is an agent output in size?
Can you show the output of free -m? Your server is may swapping which can cause massiv io constantly.
A machine being “more or less idle” is… not idle: It’s running something, and this something
may generate I/O. I do not believe it makes sense to “look in the direction of Checkmk”, especially
when you have already identified systemd (everybody’s darling…) as the “culprit”.
An I/O rate of 1-2MB/s is - in my opinion - negligible: I’m not sure what you would expect. Additionally, without intricate knowledge about your underlying infrastructure it is impossible to tell, whether this “behaviour” can be considered normal or not.
1,5MB/s is about 120GB a day for nothing. As i already described: if the Check_MK Server is down, the writes fall to about 50KB/s which is about 4MB a day. This is a big difference in my opinion. I run daily Backups and this is (even with compression enabled) a big task to copy to an offsite location. I have 8 Linux VMs in my Homelab and each of them is causing this IO, so i get almost 1TB a day in writes.
I am looking into the direction of the Check_MK Agent because the relation between the Check_MK Server running and the high write rates on all monitored VMs (8 in my Homelab and one in the Hetzner cloud) are not denyable. Again: if i stop the Check_MK Server, the write rate on all VMs falls to nearly idle conditions.
Some info about my setup:
Two Proxmox Nodes running these VMs:
2 Docker VMs
2 Proxy VMs
2 VPN Servers
1 Mail Server
Some LXC Container but we ignore them for now.
Cloud:
1 Mail Server
All machines are running Debian 11, i can’t tell if this problem existed before in Debian 10.
I have a similar setup with two Proxmox hosts and VMs and LXC containers.
Only difference is that all VMs and containers run Ubuntu LTS.
I don’t see any unusual write activity.
I stand by my statement: This isn’t an unusual amount of I/O, and you haven’t told us, what you’re checking, once your Checkmk Server is running: It is a difference whether you check 10 or 50 hosts.
I will repeat that you yourself have “determined” systemd to be the cause of I/O: How do you conclude that systemd equals the Checkmk server, where you would e.g. see nagios or cmc processes causing I/O (depending on the edition one uses)?
Furthermore I/Os are generated you say, when the Checkmk server is running, correct? Yet you somehow “blame” the agent. If you’re convinced of that, stop the server, and install Checkmk on a different host. Check this machine from another server: Do you have the same amount of I/O?
Additionally, you’re apparently running Checkmk itself in a docker container, right? I have never done that, I don’t see a reason to. You could try a “native” installation with a Debian package and compare results: If you have less I/O, obviously the containerized version incurs some overhead.
I’d be interested in the results of this particular test.
Perhaps we should first of all establish whether there is an actual problem, or this is just the “observation” of (supposedly) “high I/O”. Does this amount of - in my opinion negligible - I/O, constitute an actual problem? Personally, I don’t think so.
As I understand the initial post of @drBeam he has this “on all VMs”: That includes the server. It is not clear in this post whether we see the server, or a client.
Be that as it may, the cause of I/O, is supposedly systemd, visible in aforementioned post. How can this be either the server or the agent? If it were the server we would see I/O from either nagios or cmc, wouldn’t we? If it were the agent via systemd socket, we would (probably) see a check-mk-agent.socket or similar, right? Running - whatever - in a container, creates overhead, so this could also be a reason for elevated I/O if we’re talking about the server.
Maybe this is an idea though: One could compare I/O of the agent (but really the agent, not just some systemd process, which doesn’t tell us anything at all…) when run via a systemd socket or xinetd, which is what tribe29 recommends. Personally, I use nmon for such stuff.
i think we had a misunderstanding. The high I/O is caused on the machines that have the agent installed, NOT the server. On the server i expect some I/O to be normal. However, if i stop the Check_MK server, the I/O on the machines running the Agent falls to nearly zero.
Yes you are right, that the systemd process is causing this I/O if we look at pidstat but there must be some connection between the Check_MK server running and the agent machine having high I/O. In the meantime i tried uninstalling the Agent on a machine with typically no I/O at all: one of my VPN servers. And as i expected the I/O falls to zero. This must have somethig to do with the agent. I don’t know in which way but the is definitely something.
Yes, we probably did. Thanks for taking the time to explain the situation in more detail.
You said that you uninstalled the agent. May I ask how you were running it i.e. with the systemd socket or via xinetd? Have you compared its behaviour depending on which aforementioned “method” is used? As previously stated, the latter method (i.e. via xinetd) is the officially recommended one.
to be honest i am not sure. I used the „default“ configuration/install on Debian 11. Loaded the .deb file, installed it using dpkg and that‘s it. How can i get the information you asked for?
Well, according to the URL I posted earlier, if xinetd isn’t installed on your hosts, then the agent will most likely “switch” to the systemd socket method. To “overcome” this, install xinetd and reinstall the agent.
I have installed xinetd and can see during the install of the agent that it is using xinetd. Everything works like before but the write rate is still there. Still caused by the systemd process. Is there some way to check the files systemd is writing to?