Hello,
maybe thats the wrong topic…
Does anyone know how to access the live status and display it on Grafana?
I would like to display some data like number of hosts, services, such ‘basic’ stuff…
Regards
Sebastian
Hello,
maybe thats the wrong topic…
Does anyone know how to access the live status and display it on Grafana?
I would like to display some data like number of hosts, services, such ‘basic’ stuff…
Regards
Sebastian
Hi Sebastian,
You can use the https://github.com/tribe29/grafana-checkmk-datasource
For other data something like the Thruk datasource for Grafana is needed also for CheckMK.
Best regards
Andreas
Am Fr., 18. Okt. 2019 um 14:39 Uhr schrieb sh1ndy@gmx.de:
Hello,
maybe thats the wrong topic…
Does anyone know how to access the live status and display it on Grafana?
I would like to display some data like number of hosts, services, such ‘basic’ stuff…
Regards
Sebastian
checkmk-en mailing list
checkmk-en@lists.mathias-kettner.de
Manage your subscription or unsubscribe
https://lists.mathias-kettner.de/cgi-bin/mailman/listinfo/checkmk-en
Ahhh looks cool.
I installed it, can connect and see the hosts and services in the dropdown lists if I create a new panel.
But the metrics field is always empty (doesn’t matter which service I use) = no data to display…
Am I doing something wrong? Any ideas?
Regards
Sebastian
Gesendet: Freitag, 18. Oktober 2019 um 22:03 Uhr
Von: “Andreas Döhler” andreas.doehler@gmail.com
An: “Sebastian Schindler” sh1ndy@gmx.de
Cc: “checkmk-enlists.mathias-kettner.de” checkmk-en@lists.mathias-kettner.de
Betreff: Re: [Check_mk (english)] Accessing live status data
Hi Sebastian,
You can use the https://github.com/tribe29/grafana-checkmk-datasource
For other data something like the Thruk datasource for Grafana is needed also for CheckMK.
Best regards
Andreas
Am Fr., 18. Okt. 2019 um 14:39 Uhr schrieb sh1ndy@gmx.de:
Hello,
maybe thats the wrong topic…
Does anyone know how to access the live status and display it on Grafana?
I would like to display some data like number of hosts, services, such ‘basic’ stuff…
Regards
Sebastian
checkmk-en mailing list
checkmk-en@lists.mathias-kettner.de
Manage your subscription or unsubscribe
https://lists.mathias-kettner.de/cgi-bin/mailman/listinfo/checkmk-en
It does work for me for individual graphs:
But doesn’t work for combined graphs (I definitely do not have more than 100 metrics for interfaces on that host):
Personally, I’d get Check_MK to chuck the data into a separate InfluxDB instance using the “Send metrics to Graphite/InfluxDB” rule then get Grafana to query that. Then you’re not loading your monitoring server with direct queries from Grafana.
Cheers,
Rich
From: checkmk-en checkmk-en-bounces@lists.mathias-kettner.de On Behalf Of sh1ndy@gmx.de
Sent: 21 October 2019 17:06
To: “Andreas Döhler” andreas.doehler@gmail.com
Cc: checkmk-enlists.mathias-kettner.de checkmk-en@lists.mathias-kettner.de
Subject: Re: [Check_mk (english)] Accessing live status data
Ahhh looks cool.
I installed it, can connect and see the hosts and services in the dropdown lists if I create a new panel.
But the metrics field is always empty (doesn’t matter which service I use) = no data to display…
Am I doing something wrong? Any ideas?
Regards
Sebastian
Gesendet: Freitag, 18. Oktober 2019 um 22:03 Uhr
Von: “Andreas Döhler” andreas.doehler@gmail.com
An: “Sebastian Schindler” sh1ndy@gmx.de
Cc: “checkmk-enlists.mathias-kettner.de” checkmk-en@lists.mathias-kettner.de
Betreff: Re: [Check_mk (english)] Accessing live status data
Hi Sebastian,
You can use the https://github.com/tribe29/grafana-checkmk-datasource
For other data something like the Thruk datasource for Grafana is needed also for CheckMK.
Best regards
Andreas
Am Fr., 18. Okt. 2019 um 14:39 Uhr schrieb sh1ndy@gmx.de:
Hello,
maybe thats the wrong topic…
Does anyone know how to access the live status and display it on Grafana?
I would like to display some data like number of hosts, services, such ‘basic’ stuff…
Regards
Sebastian
checkmk-en mailing list
checkmk-en@lists.mathias-kettner.de
Manage your subscription or unsubscribe
https://lists.mathias-kettner.de/cgi-bin/mailman/listinfo/checkmk-en
Hi,
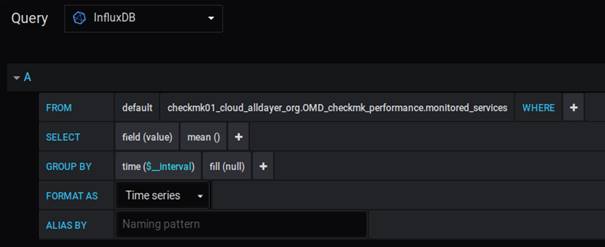
The data comes from your CMK host itself, so as long as your “Send metrics to Graphite/InfluxDB” rule encompasses that host, you can type in the “FROM” section of the query for monitored_services for example and that autocomplete to the metric from your CMK host (if you type in OMD (all caps) it will autocomplete and show you all the available metrics from your CMK instance):
I’ve then got a dashboard on a test instance that looks like this:
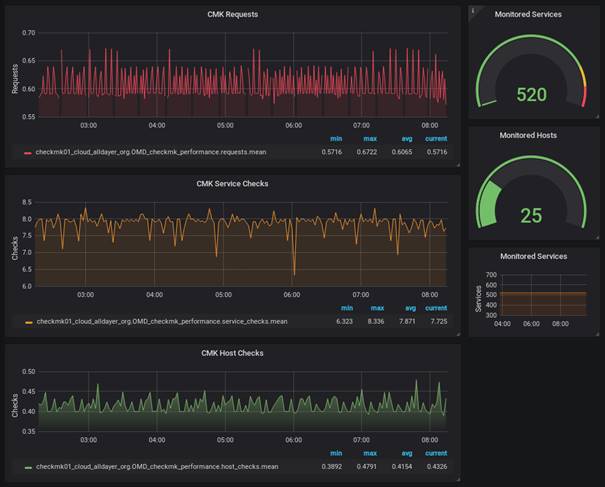
We are using CEE, so I’ve set the warning and critical levels for the Monitored Services gauge to alert just before our license limit.
Cheers,
Rich
From: Sebastian Schindler sh1ndy@gmx.de
Sent: 23 October 2019 10:00
To: Allen,R,Richard,SPCE3 R rallen@plus.net
Cc: checkmk-en@lists.mathias-kettner.de
Subject: Aw: Re: [Check_mk (english)] Accessing live status data
I’m also writing my data directly into the InfluxDB… With nagflux. But my hope was to get more data than the one I already get with nagflux.
But the data I’m missing on the grafana side is such things like the total amount of hosts, services, and other numbers like that. Just for an overview dashboard.
How do you realized that?
Regards
Sebastian
Gesendet: Dienstag, 22. Oktober 2019 um 17:39 Uhr
Von: rallen@plus.net
An: checkmk-en@lists.mathias-kettner.de
Betreff: Re: [Check_mk (english)] Accessing live status data
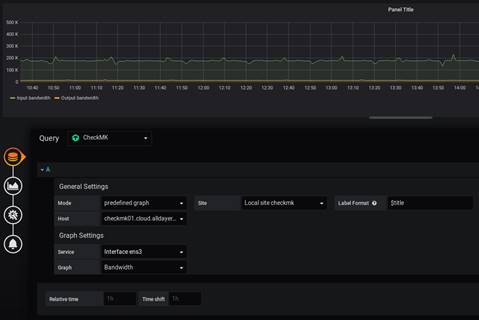
It does work for me for individual graphs:
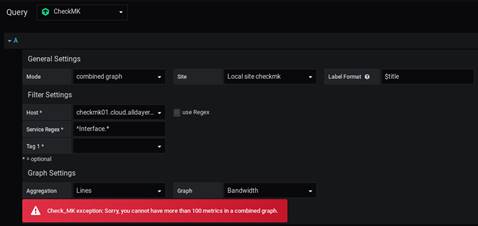
But doesn’t work for combined graphs (I definitely do not have more than 100 metrics for interfaces on that host):
Personally, I’d get Check_MK to chuck the data into a separate InfluxDB instance using the “Send metrics to Graphite/InfluxDB” rule then get Grafana to query that. Then you’re not loading your monitoring server with direct queries from Grafana.
Cheers,
Rich
From: checkmk-en checkmk-en-bounces@lists.mathias-kettner.de On Behalf Of sh1ndy@gmx.de
Sent: 21 October 2019 17:06
To: “Andreas Döhler” andreas.doehler@gmail.com
Cc: checkmk-enlists.mathias-kettner.de checkmk-en@lists.mathias-kettner.de
Subject: Re: [Check_mk (english)] Accessing live status data
Ahhh looks cool.
I installed it, can connect and see the hosts and services in the dropdown lists if I create a new panel.
But the metrics field is always empty (doesn’t matter which service I use) = no data to display…
Am I doing something wrong? Any ideas?
Regards
Sebastian
Gesendet: Freitag, 18. Oktober 2019 um 22:03 Uhr
Von: “Andreas Döhler” andreas.doehler@gmail.com
An: “Sebastian Schindler” sh1ndy@gmx.de
Cc: “checkmk-enlists.mathias-kettner.de” checkmk-en@lists.mathias-kettner.de
Betreff: Re: [Check_mk (english)] Accessing live status data
Hi Sebastian,
You can use the https://github.com/tribe29/grafana-checkmk-datasource
For other data something like the Thruk datasource for Grafana is needed also for CheckMK.
Best regards
Andreas
Am Fr., 18. Okt. 2019 um 14:39 Uhr schrieb sh1ndy@gmx.de:
Hello,
maybe thats the wrong topic…
Does anyone know how to access the live status and display it on Grafana?
I would like to display some data like number of hosts, services, such ‘basic’ stuff…
Regards
Sebastian
checkmk-en mailing list
checkmk-en@lists.mathias-kettner.de
Manage your subscription or unsubscribe
https://lists.mathias-kettner.de/cgi-bin/mailman/listinfo/checkmk-en
_______________________________________________ checkmk-en mailing list checkmk-en@lists.mathias-kettner.de Manage your subscription or unsubscribe https://lists.mathias-kettner.de/cgi-bin/mailman/listinfo/checkmk-en
Hi,
The data comes from your CMK host itself, so as long as your “Send metrics to Graphite/InfluxDB” rule encompasses that host, you can type in the “FROM” section of the query for monitored_services for example and that autocomplete to the metric from your CMK host (if you type in OMD (all caps) it will autocomplete and show you all the available metrics from your CMK instance):
I’ve then got a dashboard on a test instance that looks like this:
We are using CEE, so I’ve set the warning and critical levels for the Monitored Services gauge to alert just before our license limit.
Cheers,
Rich
From: Sebastian Schindler sh1ndy@gmx.de
Sent: 23 October 2019 10:00
To: Allen,R,Richard,SPCE3 R rallen@plus.net
Cc: checkmk-en@lists.mathias-kettner.de
Subject: Aw: Re: [Check_mk (english)] Accessing live status data
I’m also writing my data directly into the InfluxDB… With nagflux. But my hope was to get more data than the one I already get with nagflux.
But the data I’m missing on the grafana side is such things like the total amount of hosts, services, and other numbers like that. Just for an overview dashboard.
How do you realized that?
Regards
Sebastian
Gesendet: Dienstag, 22. Oktober 2019 um 17:39 Uhr
Von: rallen@plus.net
An: checkmk-en@lists.mathias-kettner.de
Betreff: Re: [Check_mk (english)] Accessing live status data
It does work for me for individual graphs:
But doesn’t work for combined graphs (I definitely do not have more than 100 metrics for interfaces on that host):
Personally, I’d get Check_MK to chuck the data into a separate InfluxDB instance using the “Send metrics to Graphite/InfluxDB” rule then get Grafana to query that. Then you’re not loading your monitoring server with direct queries from Grafana.
Cheers,
Rich
From: checkmk-en checkmk-en-bounces@lists.mathias-kettner.de On Behalf Of sh1ndy@gmx.de
Sent: 21 October 2019 17:06
To: “Andreas Döhler” andreas.doehler@gmail.com
Cc: checkmk-enlists.mathias-kettner.de checkmk-en@lists.mathias-kettner.de
Subject: Re: [Check_mk (english)] Accessing live status data
Ahhh looks cool.
I installed it, can connect and see the hosts and services in the dropdown lists if I create a new panel.
But the metrics field is always empty (doesn’t matter which service I use) = no data to display…
Am I doing something wrong? Any ideas?
Regards
Sebastian
Gesendet: Freitag, 18. Oktober 2019 um 22:03 Uhr
Von: “Andreas Döhler” andreas.doehler@gmail.com
An: “Sebastian Schindler” sh1ndy@gmx.de
Cc: “checkmk-enlists.mathias-kettner.de” checkmk-en@lists.mathias-kettner.de
Betreff: Re: [Check_mk (english)] Accessing live status data
Hi Sebastian,
You can use the https://github.com/tribe29/grafana-checkmk-datasource
For other data something like the Thruk datasource for Grafana is needed also for CheckMK.
Best regards
Andreas
Am Fr., 18. Okt. 2019 um 14:39 Uhr schrieb sh1ndy@gmx.de:
Hello,
maybe thats the wrong topic…
Does anyone know how to access the live status and display it on Grafana?
I would like to display some data like number of hosts, services, such ‘basic’ stuff…
Regards
Sebastian
checkmk-en mailing list
checkmk-en@lists.mathias-kettner.de
Manage your subscription or unsubscribe
https://lists.mathias-kettner.de/cgi-bin/mailman/listinfo/checkmk-en
_______________________________________________ checkmk-en mailing list checkmk-en@lists.mathias-kettner.de Manage your subscription or unsubscribe https://lists.mathias-kettner.de/cgi-bin/mailman/listinfo/checkmk-en
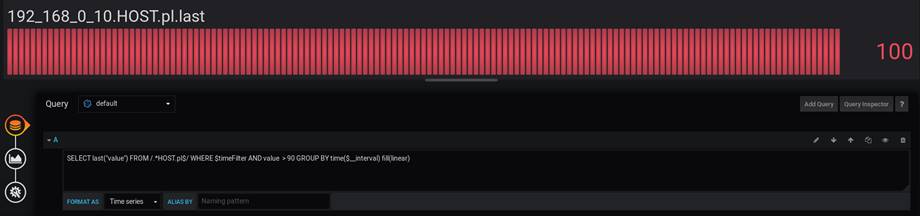
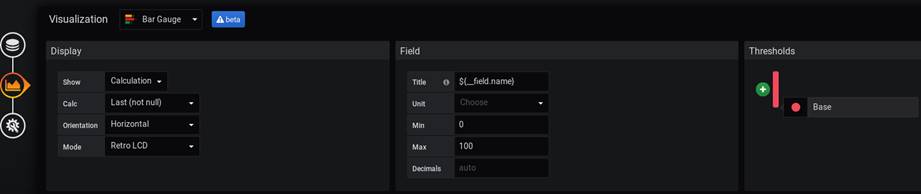
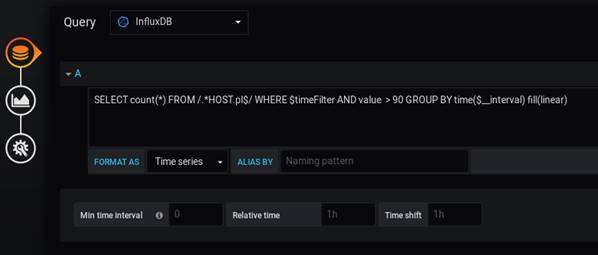
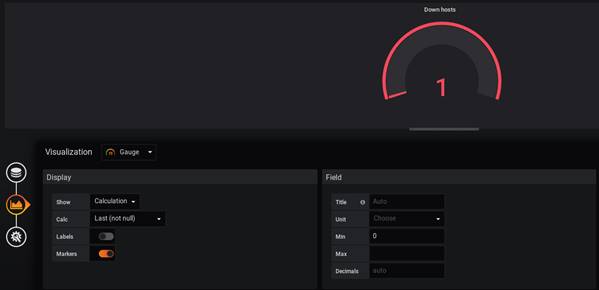
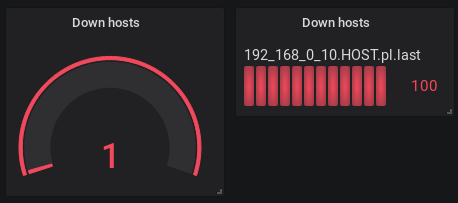
Depends how you want to visualise it. CMK doesn’t appear to give a standalone metric for hosts being down, but you can infer it from the packetloss (HOST.pl) metric e.g. where packetloss is more than 90%. In this case I have a single host down:
Gauge SQL:
Gauge vis:
Bar SQL:
Bar vis:
Then in a dashboard:
As for services, you’d need to do a separate query for each type of service to make it meaningful. In addition, I suspect this would only work for services with actual metrics (as opposed to ones that just return warn/crit etc with no performance data).
Cheers,
Rich
From: Sebastian Schindler sh1ndy@gmx.de
Sent: 23 October 2019 12:43
To: Allen,R,Richard,SPCE3 R rallen@plus.net
Cc: checkmk-en@lists.mathias-kettner.de
Subject: Aw: Re: [Check_mk (english)] Accessing live status data
Yes, found it! Thanks! 
But what about the data like the hosts or services which are in down state?
Don’t know where to find that…