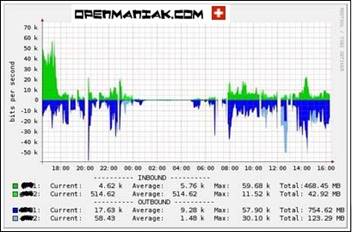
The graphs is showing in addition to current/avg/max/min bandwidth also the total sum of Traffic produced in a time period calculated by the average throughput (converted
to byte and summed to the time period).
So the question:
Is It possible to add single Values to a graph in check_mk which have been calculated by other values? I know that we can add metrics and use functions to sum them
up or sth. But this is not helping me out here. (Or I missed sth.)
As well I guess it is not possible to add metrics which are shown under the graph but do not show up in the graph itself (as line or whatever). If the visibility
Status of the metric will be changed then it currently completely disappears. Am I correct?
especially section 5.6. This might do what you want.
···
On Mon, 2019-08-05 at 07:15 +0000, Lotz, Constantin wrote:
Hi there,
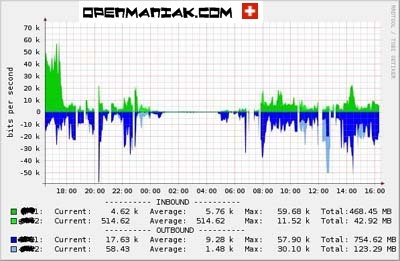
I’m knowing cacti a lot and there it was possible to create cool
network graphs like: http://openmaniak.com/cacti/cacti_traffic.jpg
The graphs is showing in addition to current/avg/max/min bandwidth
also the total sum of Traffic produced in a time period calculated by
the average throughput (converted to byte and summed to the time
period).
So the question:
Is It possible to add single Values to a graph in check_mk which have
been calculated by other values? I know that we can add metrics and
use functions to sum them up or sth. But this is not helping me out
here. (Or I missed sth.)
As well I guess it is not possible to add metrics which are shown
under the graph but do not show up in the graph itself (as line or
whatever). If the visibility Status of the metric will be changed
then it currently completely disappears. Am I correct?
i've already looked into this, but I only can sum/Product/difference (combine) some metrics, but not create my own with some more caluclations like *8 or :8 for example. In general there a no possibilities for custom calculations or?
Kind regards,
Constantin
···
-----Ursprüngliche Nachricht-----
Von: Greg Wildman [mailto:greg.wildman@techfu.co.za]
Gesendet: Montag, 5. August 2019 09:55
An: Lotz, Constantin <Constantin.Lotz@ruv-bkk.de>; checkmk-en@lists.mathias-kettner.de
Betreff: Re: [Check_mk (english)] Customize Graphs with Descriptions & Sum's ( Calculation )
On Mon, 2019-08-05 at 07:15 +0000, Lotz, Constantin wrote:
Hi there,
I’m knowing cacti a lot and there it was possible to create cool
network graphs like: http://openmaniak.com/cacti/cacti_traffic.jpg
The graphs is showing in addition to current/avg/max/min bandwidth
also the total sum of Traffic produced in a time period calculated by
the average throughput (converted to byte and summed to the time
period).
So the question:
Is It possible to add single Values to a graph in check_mk which have
been calculated by other values? I know that we can add metrics and
use functions to sum them up or sth. But this is not helping me out
here. (Or I missed sth.) As well I guess it is not possible to add
metrics which are shown under the graph but do not show up in the
graph itself (as line or whatever). If the visibility Status of the
metric will be changed then it currently completely disappears. Am I
correct?
From your example graph it looks like you are using the enteprise version. Have a look at the following: