velpulap
September 23, 2019, 8:32am
1
Hi List,
We have requirement to display all the alerts on a server in one line.
For ex:
ABC (Host Name) - 1. Service Check, 2. Service Check, 3. Service Check
Could you please help me on this.
When I’m trying to filter the option, we are seeing all alerts on the server but in different lines.
For ex:
ABC (Host Name) —> 1. Service Description —> Time
ABC (Host Name) —> 2. Service Description —> Time
ABC (Host Name) —> 3. Service Description —> Time
Thanks in advance,
Best Regards,
Praveen.
pn-rallen
September 23, 2019, 8:52am
2
Does the grid view help with this?
Cheers,
Rich
···
From: checkmk-en checkmk-en-bounces@lists.mathias-kettner.de On Behalf Of Praveen Kumar VelpulaSent: 23 September 2019 09:32To: checkmk-en@lists.mathias-kettner.de checkmk-en@lists.mathias-kettner.de Subject: [Check_mk (english)] Dashboard to display all the alerts in one line
Hi List,
We have requirement to display all the alerts on a server in one line.
For ex:
ABC (Host Name) - 1. Service Check, 2. Service Check, 3. Service Check
Could you please help me on this.
When I’m trying to filter the option, we are seeing all alerts on the server but in different lines.
For ex:
ABC (Host Name) —> 1. Service Description —> Time
ABC (Host Name) —> 2. Service Description —> Time
ABC (Host Name) —> 3. Service Description —> Time
Thanks in advance,
Best Regards,
Praveen.
1 Like
velpulap
September 23, 2019, 9:01am
3
Thank you Rallen.
We have tried this option but in this it will display all the services checks on the machine. We are looking for only the issue services only like only critical, warning, unknown.
Best Regards,
Praveen.
···
On Mon, Sep 23, 2019 at 10:52 AM rallen@plus.net wrote:
Does the grid view help with this?
Cheers,
Rich
From: checkmk-en checkmk-en-bounces@lists.mathias-kettner.de On Behalf Of Praveen Kumar VelpulaSent: 23 September 2019 09:32To: checkmk-en@lists.mathias-kettner.de checkmk-en@lists.mathias-kettner.de Subject: [Check_mk (english)] Dashboard to display all the alerts in one line
Hi List,
We have requirement to display all the alerts on a server in one line.
For ex:
ABC (Host Name) - 1. Service Check, 2. Service Check, 3. Service Check
Could you please help me on this.
When I’m trying to filter the option, we are seeing all alerts on the server but in different lines.
For ex:
ABC (Host Name) —> 1. Service Description —> Time
ABC (Host Name) —> 2. Service Description —> Time
ABC (Host Name) —> 3. Service Description —> Time
Thanks in advance,
Best Regards,
Praveen.
checkmk-en mailing list
checkmk-en@lists.mathias-kettner.de
Manage your subscription or unsubscribe
https://lists.mathias-kettner.de/cgi-bin/mailman/listinfo/checkmk-en
pn-rallen
September 23, 2019, 9:14am
4
In that case, I don’t think there’s a way to do it.
Cheers,
Rich
···
From: Praveen Kumar Velpula praveen.velpula@gmail.com Sent: 23 September 2019 10:01To: Allen,R,Richard,SPCE3 R rallen@plus.net Cc: checkmk-en@lists.mathias-kettner.de checkmk-en@lists.mathias-kettner.de Subject: Re: [Check_mk (english)] Dashboard to display all the alerts in one line
Thank you Rallen.
We have tried this option but in this it will display all the services checks on the machine. We are looking for only the issue services only like only critical, warning, unknown.
Best Regards,
Praveen.
On Mon, Sep 23, 2019 at 10:52 AM rallen@plus.net wrote:
Does the grid view help with this?
Cheers,
Rich
From: checkmk-en checkmk-en-bounces@lists.mathias-kettner.de On Behalf Of Praveen Kumar VelpulaSent: 23 September 2019 09:32To: checkmk-en@lists.mathias-kettner.de checkmk-en@lists.mathias-kettner.de Subject: [Check_mk (english)] Dashboard to display all the alerts in one line
Hi List,
We have requirement to display all the alerts on a server in one line.
For ex:
ABC (Host Name) - 1. Service Check, 2. Service Check, 3. Service Check
Could you please help me on this.
When I’m trying to filter the option, we are seeing all alerts on the server but in different lines.
For ex:
ABC (Host Name) —> 1. Service Description —> Time
ABC (Host Name) —> 2. Service Description —> Time
ABC (Host Name) —> 3. Service Description —> Time
Thanks in advance,
Best Regards,
Praveen.
checkmk-en mailing listcheckmk-en@lists.mathias-kettner.de https://lists.mathias-kettner.de/cgi-bin/mailman/listinfo/checkmk-en
velpulap
September 23, 2019, 9:21am
5
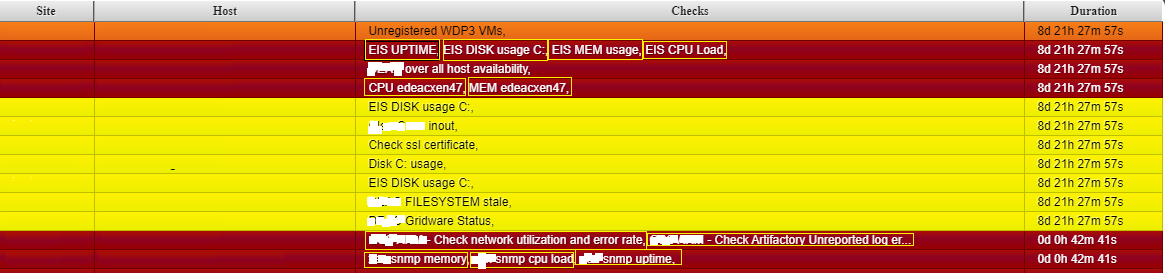
The dashboard will look this.
Hope this helps.
Thanks & Regards,
Praveen.
···
On Mon, Sep 23, 2019 at 11:14 AM rallen@plus.net wrote:
In that case, I don’t think there’s a way to do it.
Cheers,
Rich
From: Praveen Kumar Velpula praveen.velpula@gmail.com Sent: 23 September 2019 10:01To: Allen,R,Richard,SPCE3 R rallen@plus.net Cc: checkmk-en@lists.mathias-kettner.de checkmk-en@lists.mathias-kettner.de Subject: Re: [Check_mk (english)] Dashboard to display all the alerts in one line
Thank you Rallen.
We have tried this option but in this it will display all the services checks on the machine. We are looking for only the issue services only like only critical, warning, unknown.
Best Regards,
Praveen.
On Mon, Sep 23, 2019 at 10:52 AM rallen@plus.net wrote:
Does the grid view help with this?
Cheers,
Rich
From: checkmk-en checkmk-en-bounces@lists.mathias-kettner.de On Behalf Of Praveen Kumar VelpulaSent: 23 September 2019 09:32To: checkmk-en@lists.mathias-kettner.de checkmk-en@lists.mathias-kettner.de Subject: [Check_mk (english)] Dashboard to display all the alerts in one line
Hi List,
We have requirement to display all the alerts on a server in one line.
For ex:
ABC (Host Name) - 1. Service Check, 2. Service Check, 3. Service Check
Could you please help me on this.
When I’m trying to filter the option, we are seeing all alerts on the server but in different lines.
For ex:
ABC (Host Name) —> 1. Service Description —> Time
ABC (Host Name) —> 2. Service Description —> Time
ABC (Host Name) —> 3. Service Description —> Time
Thanks in advance,
Best Regards,
Praveen.
checkmk-en mailing listcheckmk-en@lists.mathias-kettner.de https://lists.mathias-kettner.de/cgi-bin/mailman/listinfo/checkmk-en
checkmk-en mailing list
checkmk-en@lists.mathias-kettner.de
Manage your subscription or unsubscribe
https://lists.mathias-kettner.de/cgi-bin/mailman/listinfo/checkmk-en
velpulap
September 24, 2019, 9:54am
6
Hello Again,
Will Check_MK supports .php module?
We are trying to import the view which we have requested in the question of getting all the critical/warning services in one row for each machine to Merlyn dashboard and it currently accepts only php modules.
Is there a way we can convert the .py modules to the form supported by Merlyn dashboard which accepts only php module.
Thanks in advance.
Best Regards,
Praveen.
···
On Mon, Sep 23, 2019 at 11:21 AM Praveen Kumar Velpula praveen.velpula@gmail.com wrote:
The dashboard will look this.
Hope this helps.
Thanks & Regards,
Praveen.
On Mon, Sep 23, 2019 at 11:14 AM rallen@plus.net wrote:
In that case, I don’t think there’s a way to do it.
Cheers,
Rich
From: Praveen Kumar Velpula praveen.velpula@gmail.com Sent: 23 September 2019 10:01To: Allen,R,Richard,SPCE3 R rallen@plus.net Cc: checkmk-en@lists.mathias-kettner.de checkmk-en@lists.mathias-kettner.de Subject: Re: [Check_mk (english)] Dashboard to display all the alerts in one line
Thank you Rallen.
We have tried this option but in this it will display all the services checks on the machine. We are looking for only the issue services only like only critical, warning, unknown.
Best Regards,
Praveen.
On Mon, Sep 23, 2019 at 10:52 AM rallen@plus.net wrote:
Does the grid view help with this?
Cheers,
Rich
From: checkmk-en checkmk-en-bounces@lists.mathias-kettner.de On Behalf Of Praveen Kumar VelpulaSent: 23 September 2019 09:32To: checkmk-en@lists.mathias-kettner.de checkmk-en@lists.mathias-kettner.de Subject: [Check_mk (english)] Dashboard to display all the alerts in one line
Hi List,
We have requirement to display all the alerts on a server in one line.
For ex:
ABC (Host Name) - 1. Service Check, 2. Service Check, 3. Service Check
Could you please help me on this.
When I’m trying to filter the option, we are seeing all alerts on the server but in different lines.
For ex:
ABC (Host Name) —> 1. Service Description —> Time
ABC (Host Name) —> 2. Service Description —> Time
ABC (Host Name) —> 3. Service Description —> Time
Thanks in advance,
Best Regards,
Praveen.
checkmk-en mailing listcheckmk-en@lists.mathias-kettner.de https://lists.mathias-kettner.de/cgi-bin/mailman/listinfo/checkmk-en
checkmk-en mailing list
checkmk-en@lists.mathias-kettner.de
Manage your subscription or unsubscribe
https://lists.mathias-kettner.de/cgi-bin/mailman/listinfo/checkmk-en
velpulap
November 25, 2019, 2:22pm
7
This option is available in 1.7.0 version and is back ported to 1.6.0 version as MKP patch.