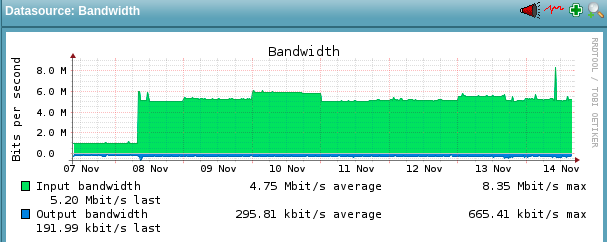
last Friday I updated check_mk to 1.6.0p5 and today to 1.6.0p6, since Friday last week the network traffic is exploding on the all check_mk instances, on the master as well on the slaves. Bellow is an example from one slave, but they all look like this:
Well I assume it has to do with the update. any idea how is this related?
It looks more like a rule not working correctly. Please take a look at the hardware/software inventory rules. If these check runs every minute or the discovery check also then these can lead to such a high bandwidth usage. I don’t see an increase in my systems at the moment.
last Friday I updated check_mk to 1.6.0p5 and today to 1.6.0p6, since Friday last week the network traffic is exploding on the all check_mk instances, on the master as well on the slaves. Bellow is an example from one slave, but they all look like this:
Well I assume it has to do with the update. any idea how is this related?
`
-- Beste Grüße
Ghassan Elrayah
Mail:
ghassan.elrayah@live.de
the HW/SW Inventory is set to once a day. I disabled the periodic service discovery months a go, and the service check interval is set to 3 minutes. These rules were set last year as I setup our distributed monitoring and never changed any thing since then.
As the metrics show, it began just after the update.
Maybe I should start searching for rule that is not working correctly, which will be difficult, since rules are set in a daily manner by different admins.
Thanks a bunch
`
···
On 11/14/19 8:25 PM, Andreas Döhler wrote:
Hi Ghassan,
It looks more like a rule not working correctly. Please take a look at the hardware/software inventory rules. If these check runs every minute or the discovery check also then these can lead to such a high bandwidth usage. I don’t see an increase
in my systems at the moment.
last Friday I updated check_mk to 1.6.0p5 and today to 1.6.0p6, since Friday last week the network traffic is exploding on the all check_mk instances, on the master as well on the slaves. Bellow is an example from one slave, but they all look like this:
Well I assume it has to do with the update. any idea how is this related?
`
-- Beste Grüße
Ghassan Elrayah
Mail: ghassan.elrayah@live.de
How big is the system with the graphs? The amount of hosts in relevant.
With this information it is possible to calculate the amount of data per host an also per second on your interface.
If this is not matching then something on your system must be wrong.
the HW/SW Inventory is set to once a day. I disabled the periodic service discovery months a go, and the service check interval is set to 3 minutes. These rules were set last year as I setup our distributed monitoring and never changed any thing since then.
As the metrics show, it began just after the update.
Maybe I should start searching for rule that is not working correctly, which will be difficult, since rules are set in a daily manner by different admins.
Thanks a bunch
`
On 11/14/19 8:25 PM, Andreas Döhler wrote:
Hi Ghassan,
It looks more like a rule not working correctly. Please take a look at the hardware/software inventory rules. If these check runs every minute or the discovery check also then these can lead to such a high bandwidth usage. I don’t see an increase
in my systems at the moment.
last Friday I updated check_mk to 1.6.0p5 and today to 1.6.0p6, since Friday last week the network traffic is exploding on the all check_mk instances, on the master as well on the slaves. Bellow is an example from one slave, but they all look like this:
Well I assume it has to do with the update. any idea how is this related?
`
-- Beste Grüße
Ghassan Elrayah
Mail: ghassan.elrayah@live.de
The previous attached graph is from a system with ~ 700 hosts and ~24000 services, the second biggest has ~450 hosts and ~15000 services, the third biggest has ~400 hosts and ~10000 services, the other slaves has between 70-80 hosts and ~2000 services each.
···
On 11/14/19 9:54 PM, Andreas Döhler wrote:
How big is the system with the graphs? The amount of hosts in relevant.
With this information it is possible to calculate the amount of data per host an also per second on your interface.
If this is not matching then something on your system must be wrong.
the HW/SW Inventory is set to once a day. I disabled the periodic service discovery months a go, and the service check interval is set to 3 minutes. These rules were set last year as I setup our distributed monitoring and never changed any thing since then.
As the metrics show, it began just after the update.
Maybe I should start searching for rule that is not working correctly, which will be difficult, since rules are set in a daily manner by different admins.
Thanks a bunch
`
On 11/14/19 8:25 PM, Andreas Döhler wrote:
Hi Ghassan,
It looks more like a rule not working correctly. Please take a look at the hardware/software inventory rules. If these check runs every minute or the discovery check also then these can lead to such a high bandwidth usage. I don’t see an increase
in my systems at the moment.
last Friday I updated check_mk to 1.6.0p5 and today to 1.6.0p6, since Friday last week the network traffic is exploding on the all check_mk instances, on the master as well on the slaves. Bellow is an example from one slave, but they all look like this:
Well I assume it has to do with the update. any idea how is this related?
`
-- Beste Grüße
Ghassan Elrayah
Mail:
ghassan.elrayah@live.de
The previous attached graph is from a system with ~ 700 hosts and ~24000 services, the second biggest has ~450 hosts and ~15000 services, the third biggest has ~400 hosts and ~10000 services, the other slaves has between 70-80 hosts and ~2000 services each.
On 11/14/19 9:54 PM, Andreas Döhler wrote:
How big is the system with the graphs? The amount of hosts in relevant.
With this information it is possible to calculate the amount of data per host an also per second on your interface.
If this is not matching then something on your system must be wrong.
the HW/SW Inventory is set to once a day. I disabled the periodic service discovery months a go, and the service check interval is set to 3 minutes. These rules were set last year as I setup our distributed monitoring and never changed any thing since then.
As the metrics show, it began just after the update.
Maybe I should start searching for rule that is not working correctly, which will be difficult, since rules are set in a daily manner by different admins.
Thanks a bunch
`
On 11/14/19 8:25 PM, Andreas Döhler wrote:
Hi Ghassan,
It looks more like a rule not working correctly. Please take a look at the hardware/software inventory rules. If these check runs every minute or the discovery check also then these can lead to such a high bandwidth usage. I don’t see an increase
in my systems at the moment.
last Friday I updated check_mk to 1.6.0p5 and today to 1.6.0p6, since Friday last week the network traffic is exploding on the all check_mk instances, on the master as well on the slaves. Bellow is an example from one slave, but they all look like this:
Well I assume it has to do with the update. any idea how is this related?
`
-- Beste Grüße
Ghassan Elrayah
Mail: ghassan.elrayah@live.de
`Well I was wondering too, and I thought my calculation was wrong and there other criterias need to be considered, since the traffic used to be low as the metrics show. But now it sounds very logical. I will ignore this for now and keep an eye on it.
But I cannot understand why the traffic indeed was low (which wasn’t supposed to be) and suddenly so high in compare (which seems to be correct/normal).
Thanks Andres `
···
On 11/14/19 10:54 PM, Andreas Döhler wrote:
Now we do a little bit of calculation.
700 host with 3 minute interval → that means 4 hosts per second
Your traffic is around 5 MBit → 1.25 MBit per host → 156 kByte traffic for one host circa.
A normal server at my home site has between 50kByte and 250kByte.
I would say that this is not an unusual traffic. Before it was strange with traffic so low.
The previous attached graph is from a system with ~ 700 hosts and ~24000 services, the second biggest has ~450 hosts and ~15000 services, the third biggest has ~400 hosts and ~10000 services, the other slaves has between 70-80 hosts and ~2000 services each.
On 11/14/19 9:54 PM, Andreas Döhler wrote:
How big is the system with the graphs? The amount of hosts in relevant.
With this information it is possible to calculate the amount of data per host an also per second on your interface.
If this is not matching then something on your system must be wrong.
the HW/SW Inventory is set to once a day. I disabled the periodic service discovery months a go, and the service check interval is set to 3 minutes. These rules were set last year as I setup our distributed monitoring and never changed any thing since then.
As the metrics show, it began just after the update.
Maybe I should start searching for rule that is not working correctly, which will be difficult, since rules are set in a daily manner by different admins.
Thanks a bunch
`
On 11/14/19 8:25 PM, Andreas Döhler wrote:
Hi Ghassan,
It looks more like a rule not working correctly. Please take a look at the hardware/software inventory rules. If these check runs every minute or the discovery check also then these can lead to such a high bandwidth usage. I don’t see an increase
in my systems at the moment.
last Friday I updated check_mk to 1.6.0p5 and today to 1.6.0p6, since Friday last week the network traffic is exploding on the all check_mk instances, on the master as well on the slaves. Bellow is an example from one slave, but they all look like this:
Well I assume it has to do with the update. any idea how is this related?
`
-- Beste Grüße
Ghassan Elrayah
Mail: ghassan.elrayah@live.de