Hello,
Does anyone have insight into the types of rules or configuration items that cause a massive, permanent CPU spike in the running of Check_MK 1.2.8pX ?
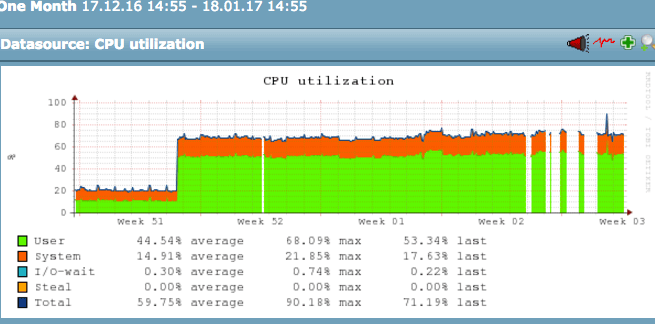
My situation is that I have a monitoring server that has 500 or so hosts monitored, about 20,000 services. Sometime around mid December, the average CPU utilization of the monitoring server jumped from 20% to over 70%, sustained, and stayed that way forever (attaching screenshot). I’m trying to figure that out as the jump was massive and immediate.
Here’s what did and did not change:
*** There are no new hosts added to be monitored since before the spike! Maybe a few custom (local) checks.
*** The hardware of the box is still the same 12-core box as before the spike
*** No other non-Check_MK processes or omd sites are running on the server, before or now
*** I’ve tried restarting the entire monitoring server (via Matias’ “omd” installation, btw) numerous times
I tried looking at the audit log and all I saw of interest was one item on that day, which changed “Maximum number of checks attempt for service” rule to 16 for one service. I removed that rule with no real effect on load.
I also looked at the top running processes, it’s mostly short-lived python processes doing a wide variety of things.
One of the reasons I care about this issue is that there are starting to be time gaps in the rrd graphs for services, and I’m suspecting high load on the monitoring server could be to blame.
My theory is that either
a) I’m hitting a bug in this version of Check_MK
b) I have a rule that’s causing headaches in the processing, or an errant option someplacein the monitoring config
c) the RRD db’s have gotten large (although I doubt that’s the cause)
d) the Python version being used with my installation, 2.6.6 has some issues for some reason only being seen now.
Are there any devs viewing this that might suggest how to troubleshoot? Is there a mode or a log that can clue me in here?
Thanks!