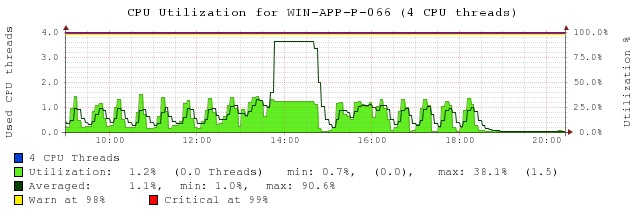
Looking at the graphs it looks like the monitoring server was not able
to get the data from the Windows agent on your host. This was caused by
the high CPU load. So this is a situation where no data was available
and therefor the CPU load check could not alarm.
Have a look at the "Check_MK" service check of this host during the time
of the incident. It should have reported a non-OK state.
Regards
···
Am 18.12.2016 um 16:03 schrieb Gerardo Ferreyra:
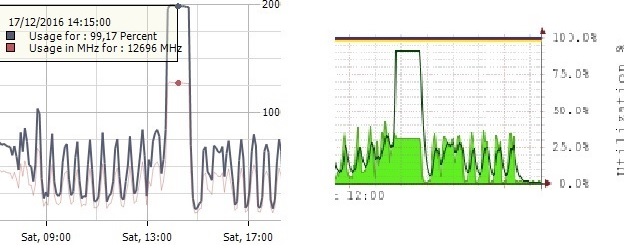
*VMware and Windows* (task manager), showed during that time, 100% cpu
usage.
*Check_mk *showed only *25%*.
--
Robert Sander
Heinlein Support GmbH
Schwedter Str. 8/9b, 10119 Berlin
Tel: 030 / 405051-43
Fax: 030 / 405051-19
Zwangsangaben lt. §35a GmbHG:
HRB 93818 B / Amtsgericht Berlin-Charlottenburg,
Geschäftsführer: Peer Heinlein -- Sitz: Berlin
> *VMware and Windows* (task manager), showed during that
time, 100% cpu
        > usage.

        > *Check_mk *showed only *25%*.


        Looking at the graphs it looks like the monitoring server
was not able
to get the data from the Windows agent on your host. This
was caused by
the high CPU load. So this is a situation where no data was
available
        and therefor the CPU load check could not alarm.


        Have a look at the "Check_MK" service check of this host
during the time
        of the incident. It should have reported a non-OK state.


        Regards

        --

        Robert Sander

        Heinlein Support GmbH

        Schwedter Str. 8/9b, 10119 Berlin


        [http://www.heinlein-support.de](http://www.heinlein-support.de)


        Tel: 030 / 405051-43

        Fax: 030 / 405051-19


        Zwangsangaben lt. �35a GmbHG:

        HRB 93818 B / Amtsgericht Berlin-Charlottenburg,

        Gesch�ftsf�hrer: Peer Heinlein -- Sitz: Berlin


        _______________________________________________

        checkmk-en mailing list

        checkmk-en@lists.mathias-kettner.de

        [http://lists.mathias-kettner.de/mailman/listinfo/checkmk-en](http://lists.mathias-kettner.de/mailman/listinfo/checkmk-en)
_______________________________________________
checkmk-en mailing list
> *VMware and Windows* (task manager), showed during that
time, 100% cpu
> usage.
> *Check_mk *showed only *25%*.
Looking at the graphs it looks like the monitoring server
was not able
to get the data from the Windows agent on your host. This
was caused by
the high CPU load. So this is a situation where no data was
available
and therefor the CPU load check could not alarm.
Have a look at the "Check_MK" service check of this host
during the time
of the incident. It should have reported a non-OK state.
Regards
--
Robert Sander
Heinlein Support GmbH
Schwedter Str. 8/9b, 10119 Berlin
[http://www.heinlein-support.de](http://www.heinlein-support.de)
Tel: 030 / 405051-43
Fax: 030 / 405051-19
Zwangsangaben lt. §35a GmbHG:
HRB 93818 B / Amtsgericht Berlin-Charlottenburg,
Geschäftsführer: Peer Heinlein -- Sitz: Berlin
_______________________________________________
checkmk-en mailing list
checkmk-en@lists.mathias-kettner.de
[http://lists.mathias-kettner.de/mailman/listinfo/checkmk-en](http://lists.mathias-kettner.de/mailman/listinfo/checkmk-en)