I have created a Dashboard in Grafana which uses InfluxDB as a Datasource to catch the Metrics for Network Interfaces ( Cisco ) . ( sent by check-mk )
In addition i have created a infinity Datasource to pull Status and Summary ( with IfAlias ) as a Dashboard Selection for the selected Host and Interface from checkmk view via csv/json plugin.
The reason for this is, that we want some “Customer Description” used in the Dashboard and the User selects this Description only without knowing or showing the releated host and interface . And the Dashboard does not need any change - adding the correct Interface Alias on the Router enables all.
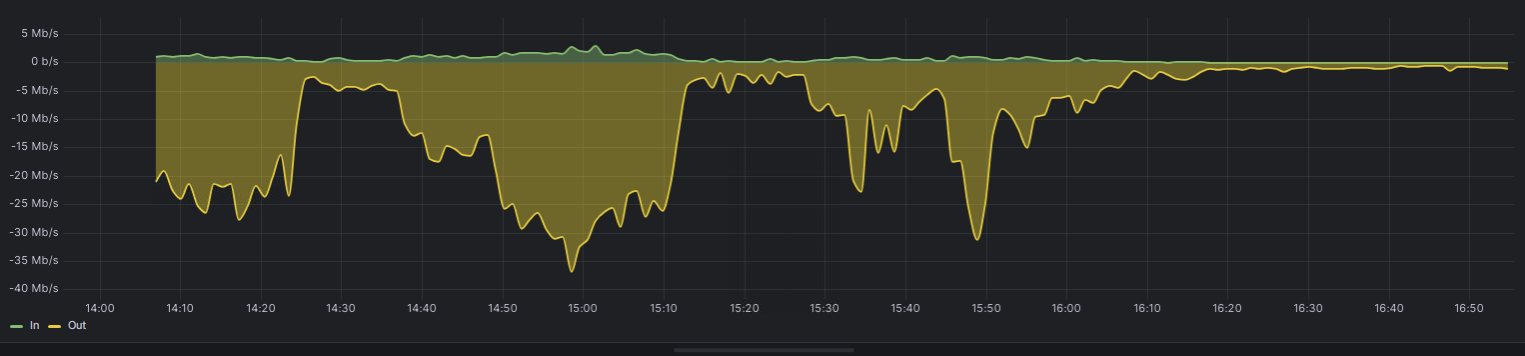
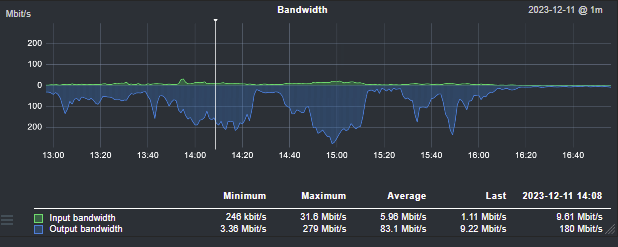
This works all well, but now i have some difficulties to understand the Values stored in the InfluxDB or the Unit shown/used in Grafana .
What kind of Values are forwarded from check-mk to influxDB for the SNMP Interface in / out ?
3 Dashboad Variables ( infinity - checkmk view json/csv ( has hostname , interface_name, summary)
1 regex summary to get User Description (csv)
2 get hostname where summary like query1 (json)
3 get interface_name where summary like query1 (json)
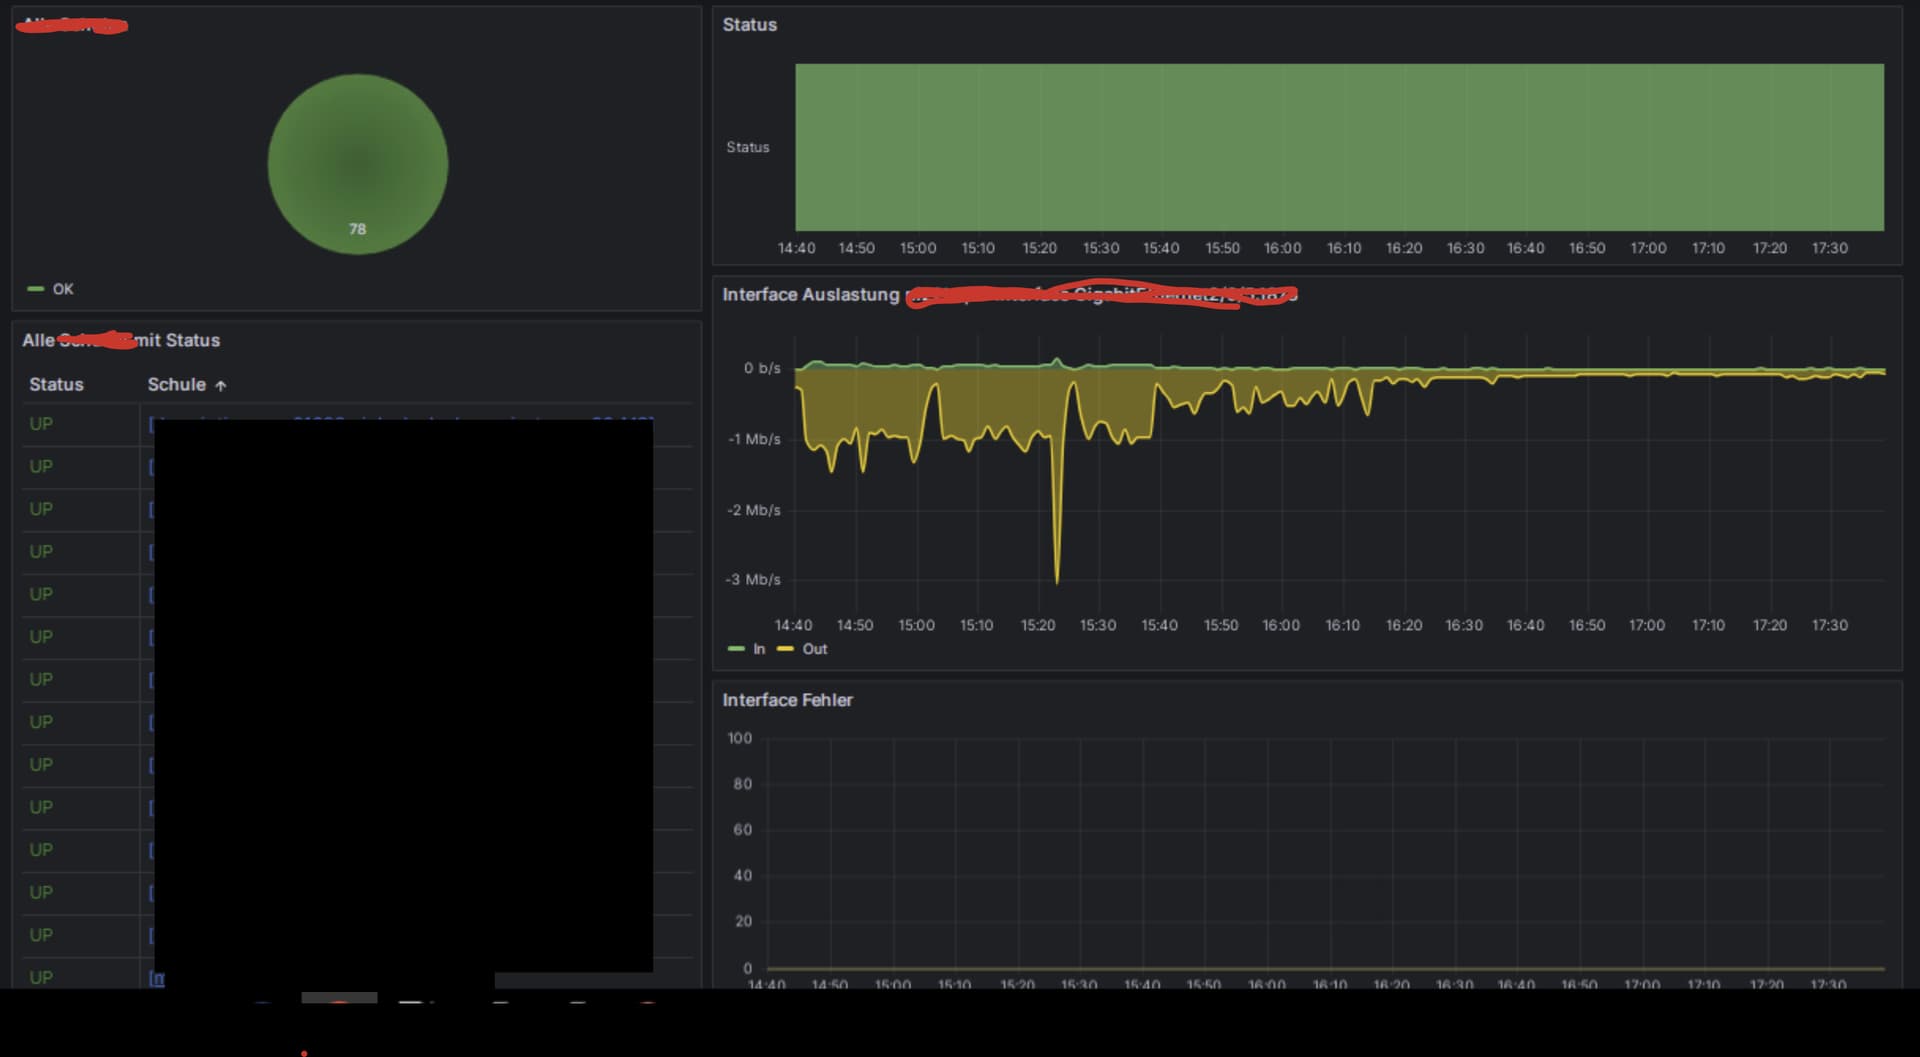
78 Interfaces Summary Status ( check-mk view - infinity pull service_state )
78 Lines with Service_State + regex from Summary in Table ( check-mk view - inifity state+summary)
( Datalink sets User Description which sets host_name and interface_name )
3 Influx Query over time on Status, In and Out, and Interface Errors with $hostname and $interface as filter.
Still beginner, but anyway needed still some weeks to get there where i am now lol .
( starting point 0 for influx/grafana )
What took me long was to use infinity instead of csv.
So maybe this helps someone to do something similar.
Why going thru this
Customer should not access Admin Monitoring tool
Customer should not see related Host and Interface
Not another Polling as we have ( check-mk )
If new Line/Interface is deployed correctly no Configurations needs to be done. ( ifAlias match )
The Unit Messurement is the only point with i do not understand currently …
This topic was automatically closed 365 days after the last reply. New replies are no longer allowed. Contact an admin if you think this should be re-opened.