cd /opt/omd/versions/2.0.0p7.cfe/share/pnp4nagios/htdocs/application/controllers/
wget https://raw.githubusercontent.com/lingej/pnp-metrics-api/master/application/controller/api.php
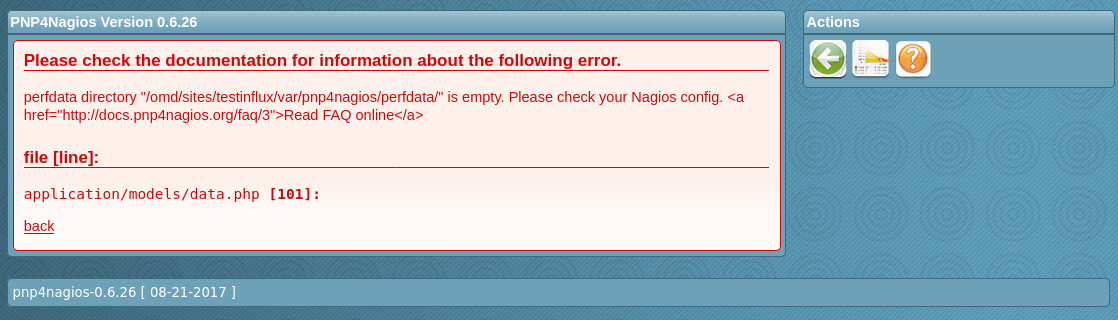
As you use the free edition it has no PNP4Nagios active anymore.
The free edition is the same as the enterprise with 25 host limit.
Also with the raw edition of 2.0 you can have problems as the PNP4Nagios is not working anymore there for 100%.
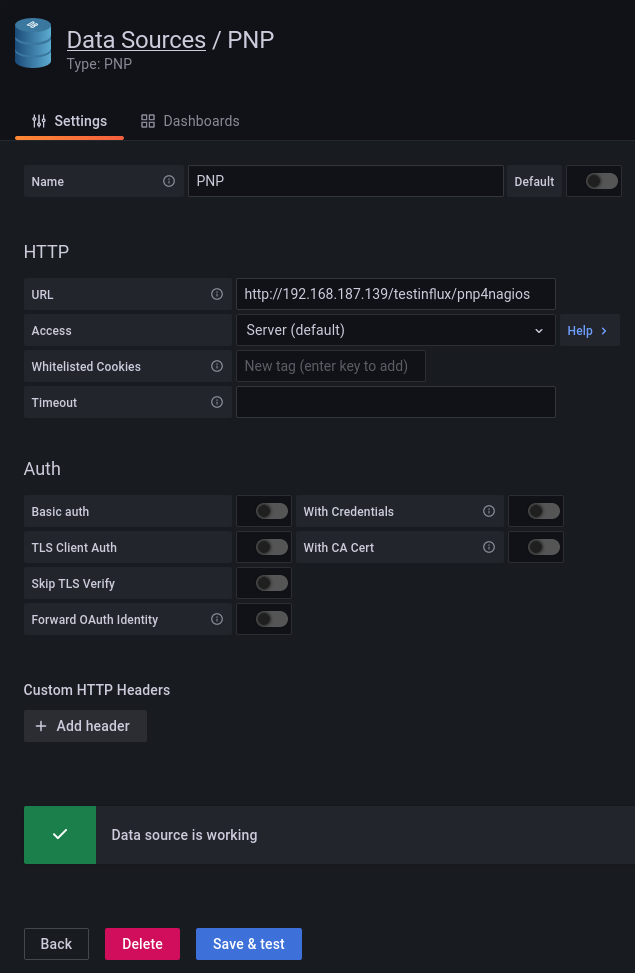
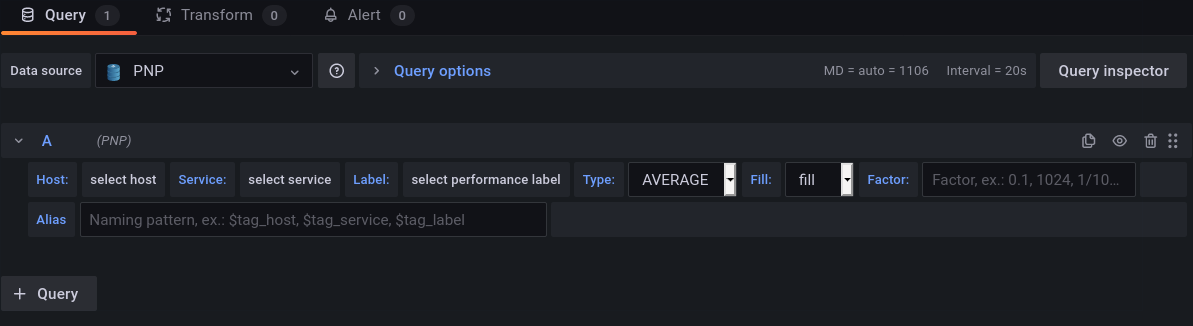
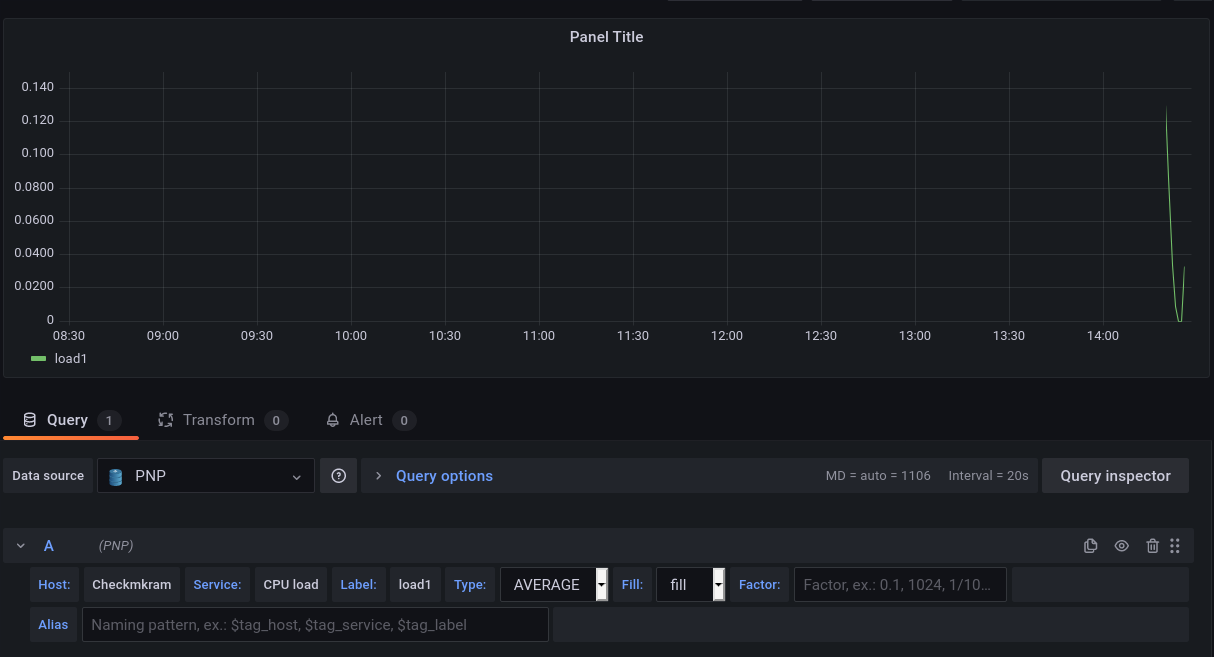
I think it is a little bit different. With the PNP4Nagios connector inside grafana you pull the data from PNP4Nagios every time your draw a graph. Datastorage is here the monitoring server with it’s rrd files.
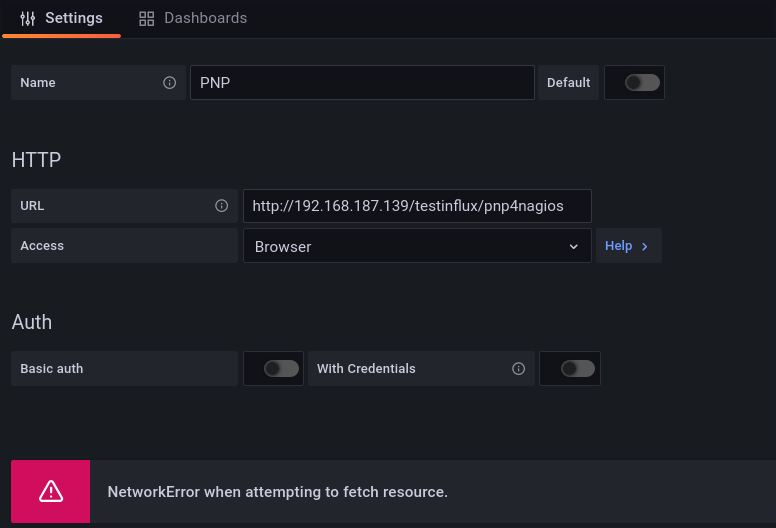
The InfluxDB version sent’s really all data to the DB and grafana then takes the data from InfluxDB as it does it with other data from there. I don’t want to say what is better is it depends on your usage.
This topic was automatically closed 365 days after the last reply. New replies are no longer allowed. Contact an admin if you think this should be re-opened.