CMK version:
2.2.0p25 raw
OS version:
oracle linux 8
What do I need to do so that the numerical result from the SQL query is plotted on the graph?
I have sample query
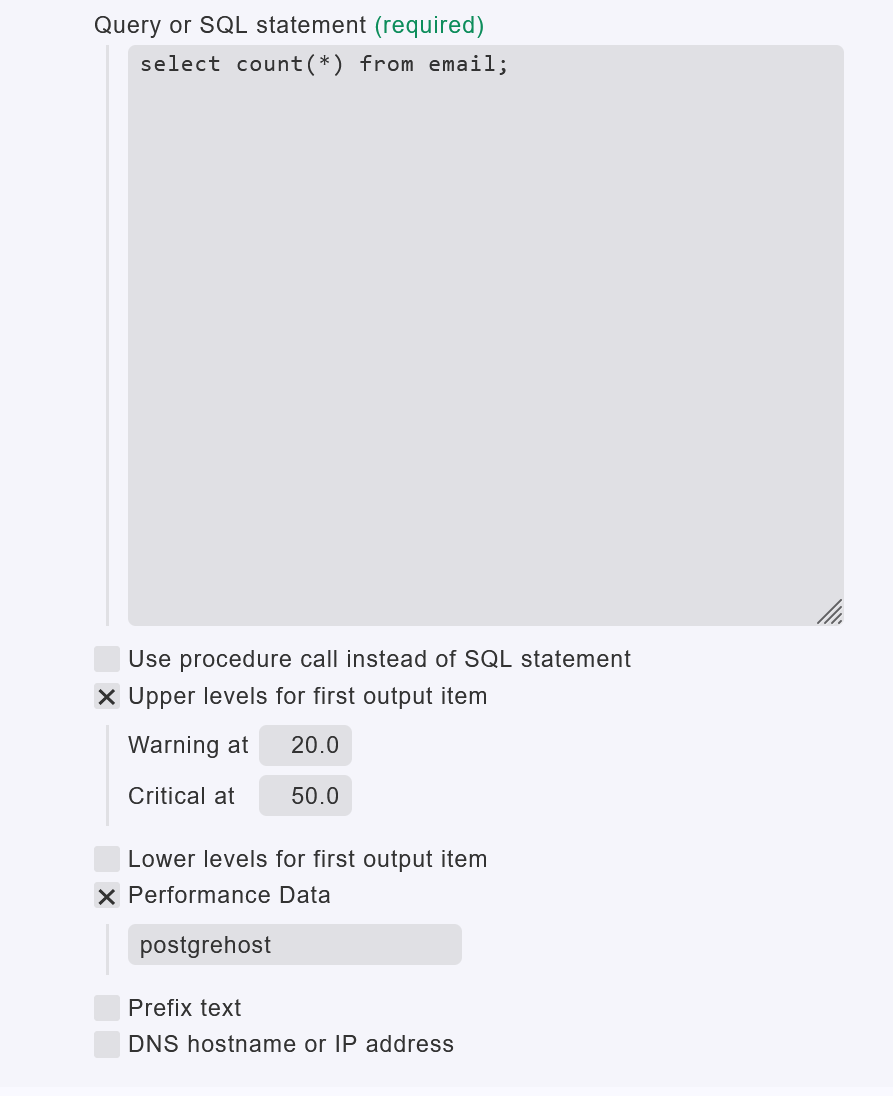
Result is

Service check command:
check_mk_active-sql!'--hostname=$HOSTADDRESS$' --dbms=postgres --name=XXX --user=XXX --password=XXX --port=5432 --metrics=postgrehost -w:20.0 -c:50.0 'select count(*) from email\\;\\n'
I don’t see anything related to sql query in the rrd folder
/opt/omd/sites/checkmk/var/pnp4nagios/perfdata/postgrehost
What I’m missing