We’re running CMK 1.6.0p22 with about 30,000 service checks.
cmc_cmk_helpers = 70 (usage 20%)
cmc_check_helpers = 30 (usage 30%)
cmc_livestatus_threads = 40 (usage 2%)
This gets me a snappy GUI and check performance, about 650 host checks per second and 450 service checks per second.
In order to test upgrade to CMK 2.0.0p3 I’ve done “omd cp” and replaced ~/var/rrd with a symlink to /dev/null as theres not enough space on disk for yet another 50 GB of RRD files.
In my mind this should even artificially improve performance numbers for the new instance as no disk I/O for RRD happens.
Anyway, once I start up the new instance (while shutting down the production instance on the same host as to not to interfere), one of 2 scenarios happens:
I set fetch / check helpers to low values like 10 or 20. Web GUI remains usable (although not as performant as 1.6.0), but checks obviously are delayed for minutes. services that rely on piggyback data constantly complain that their piggyback files are too old
I set fetch / check helpers to 40 (which isn’t completely outrageous, with 2x Xeon CPUs and 128 GB RAM) and the Web GUI becomes SLOOOOOOOOOOOOW as molasses. I actually need to reset the values on CLI (etc/check_mk/conf.d/wato/global.mk) because it takes about 8 minutes to do it by web.
If I can trust the snapin values, I then get about 100 service checks per second. Still a faaaaaar cry from my original numbers.
What am I doing wrong? Is there some kind of conversion formular “old values” → “new values”?
Am I missing some new Livestatus toggle?
By the way, setting the toggle to not use fetcher and checker helpers separately doesn’t help either.
Confusing for me:
even if checker/fetcher helpers would be falling over themselves executing checks, GUI should remain as responsive as ever because this is only bottlenecked by Livestatus queries? And there is most certainly no bottleneck there, with exactly 1 user testing the new instance
Also confusing:
the server itself (CPU/RAM) is not at all overwhelmed with the higher number of check helpers. I can even launch the original prod site in parallel and that site continues to hum along just fine, with several 100 checks per second and instant response on click, meanwhile the new site is basically dead (sometimes it even says so, it cannot reach the livestatus socket or does not get a response).
rrcached seems to be at fault… are the settings reset or something?
Once I shut off performance data processing, everything works just fine, about 500 service checks per second. As soon as I re-enable it, everything slows to a crawl
This is expected from my side.
The reason is you symlink to /dev/null for the performance data folder.
It tries to access these files for every check or tries to read the files for every GUI refresh.
I figured the same, therefore went ahead with the update on the production instance today.
Yet what I wrote today pertains to the production instance, actually… No /dev/null in sight here, only honest, hard working RRD files.
Checking the processes, it is the --create-rrd cmk process that is responsible for the load apparently, not the rrdcached itself or its updates to existing RRD files.
… so it seems it might be a one-time onslaught after the major upgrade, however long it may take? Although I’m wondering why the cmk process thinks it needs to create any of those RRD files in the first place, as they are already there. Also, disk usage for the /opt/ partition remains more or less unchanged, so there is indeed no such thing as a “RRD creation” actually happening.
Is this process misnamed maybe, and instead some kind of convert-rrds is happening instead? (I didn’t change any RRD parameters during upgrade, obviously)
As suspected:
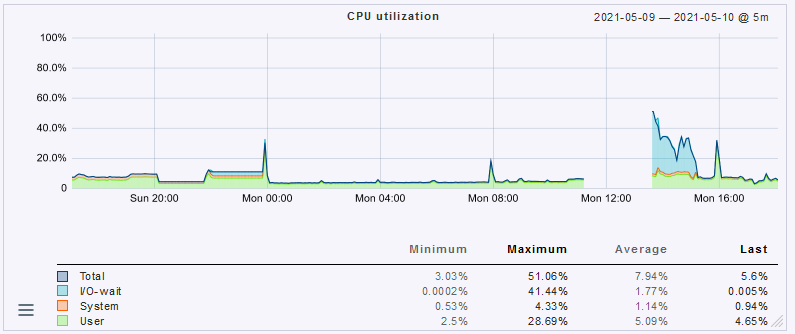
“creation” happens again and again, or at least the cmk process seems to think so and apparently does “whatever” to produce a significant amount of disk writes, therefore system load does not really decrease and remains at about 30 (usually is about ~1)
2021-05-10 13:30:15 [6] [main] dropping cached information about service “router104;Interface pfe-1/1/0.16383”
2021-05-10 13:30:15 [6] [main] [RRD helper 1548] created RRD for service “router104;Interface pfe-1/1/0.16383”, metric outqlen
2021-05-10 13:30:15 [6] [main] [RRD helper 1548] created RRD for service “router104;Interface pfe-1/1/0.16383”, metric outdisc
…
2021-05-10 13:30:51 [6] [main] reading metrics of service “router104;Interface pfe-1/1/0.16383” from “/opt/omd/sites/prod/var/check_mk/rrd/router104/Interface_pfe-1_1_0.16383.info”
2021-05-10 13:47:50 [6] [main] dropping cached information about service “router104;Interface pfe-1/1/0.16383”
2021-05-10 13:47:50 [6] [main] [RRD helper 1548] created RRD for service “router104;Interface pfe-1/1/0.16383”, metric outqlen
2021-05-10 13:47:50 [6] [main] [RRD helper 1548] created RRD for service “router104;Interface pfe-1/1/0.16383”, metric outdisc
…
OMD[rgi]:~$ ls -l /opt/omd/sites/prod/var/check_mk/rrd/router104/Interface_pfe-1_1_0.16383.*
-rw-rw---- 1 prod prod     169 May 10 13:47 /opt/omd/sites/rgi/var/check_mk/rrd/router104/Interface_pfe-1_1_0.16383.info
-rw-r--r-- 1 prod prod 5750760 May 10 13:47 /opt/omd/sites/rgi/var/check_mk/rrd/router104/Interface_pfe-1_1_0.16383.rrd
The update process mentioned “messed up” RRDs (whatever this means in detail) for 5 RRDs / INFOs, like this:
-| RRD files for host rad01 and service Filesystem / stored in files:
-| - /opt/omd/sites/prod/var/check_mk/rrd/rad01/Filesystem__.info
-| - /opt/omd/sites/prod/var/check_mk/rrd/rad01/Filesystem__.rrd
-| are messed up. Please restore them both from backup.
I’ve deleted them outright before I’d even started the updated site for the first time.
I’m going to monitor the behavior for a few more minutes, maybe to a convert-rrds for good measure? (but there wasn’t anything wrong beforehand, when changing RRD parameters in the past the convert-rrd was executed manually and finished just fine).
But doesn’t really look like it’s going to slow down by itself, here’s another example:
OMD[prod]:~$ grep "router01.*mem_lnx_total_used" var/log/cmc.log
2021-05-10 13:23:19 [6] [main] [RRD helper 21859] creating new RRD file for service "router01;Memory used", command: cmc_single;router01;Memory used;memused;;ramused;;swapused;;mem_lnx_total_used;21680128;mem_used_percent;32.305908;mem_used;21680128
2021-05-10 13:28:55 [6] [main] [RRD helper 1548] creating new RRD file for service "router01;Memory used", command: cmc_single;router01;Memory used;memused;;ramused;;swapused;;mem_lnx_total_used;21680128;mem_used_percent;32.305908;mem_used;21680128
2021-05-10 13:29:59 [6] [main] [RRD helper 1548] creating new RRD file for service "router01;Memory used", command: cmc_single;router01;Memory used;memused;;ramused;;swapused;;mem_lnx_total_used;21696512;mem_used_percent;32.330322;mem_used;21696512
2021-05-10 13:31:04 [6] [main] [RRD helper 1548] creating new RRD file for service "router01;Memory used", command: cmc_single;router01;Memory used;memused;;ramused;;swapused;;mem_lnx_total_used;21696512;mem_used_percent;32.330322;mem_used;21696512
2021-05-10 13:32:08 [6] [main] [RRD helper 1548] creating new RRD file for service "router01;Memory used", command: cmc_single;router01;Memory used;memused;;ramused;;swapused;;mem_lnx_total_used;21708800;mem_used_percent;32.348633;mem_used;21708800
2021-05-10 13:32:25 [6] [main] [RRD helper 1548] created RRD for service "router01;Memory used", metric mem_lnx_total_used
2021-05-10 13:51:20 [6] [main] [RRD helper 1548] created RRD for service "router01;Memory used", metric mem_lnx_total_used
2021-05-10 14:03:53 [6] [main] [RRD helper 1548] created RRD for service "router01;Memory used", metric mem_lnx_total_used
What happened between the first few lines, and the last three lines? I don’t know.
EDIT: Ah, the first few lines say “creating” and the last 3 “created”? So maybe everything’s fine once a corresponding 4th “created” entry appears, same amount as the “creating” lines before? (not sure if the single line in the beginning, before I restarted the instance yet again, counts and I need 5 “created” actually)
This topic was automatically closed 365 days after the last reply. New replies are no longer allowed. Contact an admin if you think this should be re-opened.