It would be nice if Checkmk also graphed the RX/TX of bytes for interfaces, this way you can see how much data has gone through an interface, over x time.
Currently you can only see spikes in traffic but doesn’t tell you how much data was consumed.
Maybe this exists, but looking about, I can’t find anything.
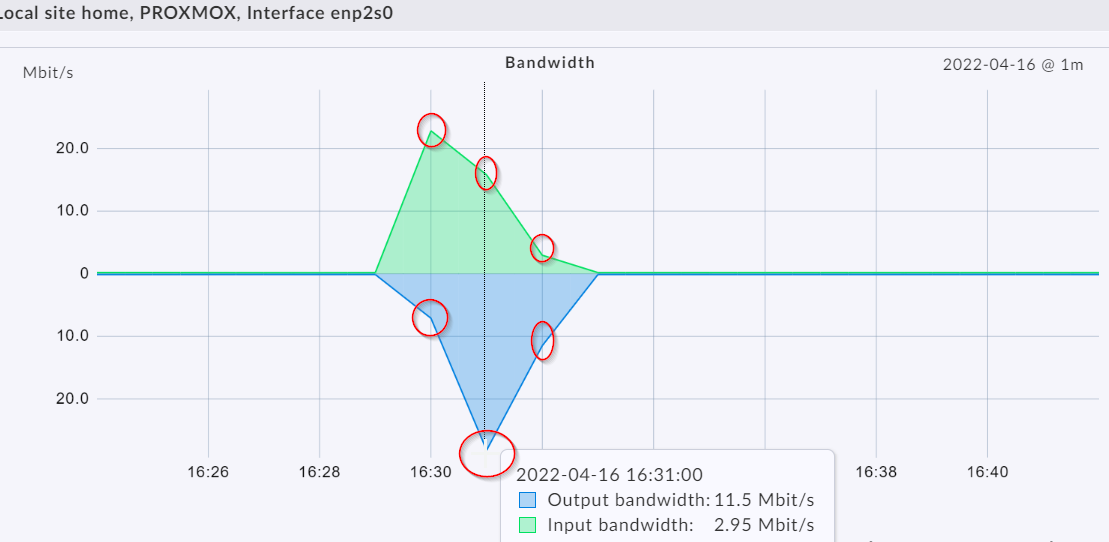
In my screenshot i have a normal 1 minute check interval and you see 16:30 - around 8 Mbit/s output for the last minute, 16:30 - 11.5 Mbit/s for the last minute and so on.
Where do you see the problem exactly?
Do you want the increasing counter as an graph?
What I mean is you don’t know how much data was transferred over that timespan.
There’s no total. It may have transferred something at 11.5Mbit, but that could of been 5 seconds worth of data or 30 seconds at 11.5Mbit, how much data was transferred, that we don’t know.
I hope this makes sense?
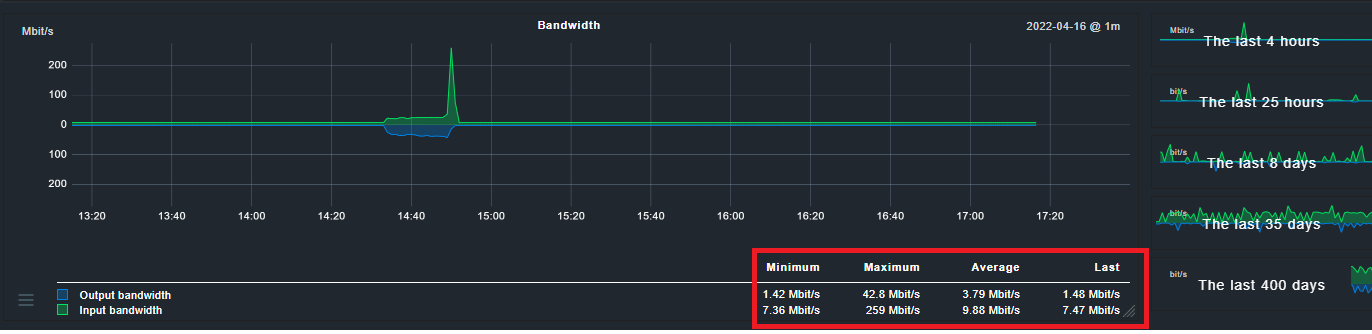
We only have Minimum, Maximum, Average, Last, No total bandwidth In/Out.
I know what you want - the total bandwidth usage over the displayed time in the diagram.
What i tried to describe is that you have only the total bandwidth usage over the time interval of two checks. In my example graph the 11.5 Mbits at 16:31 means that over the last minute i had an outgoing traffic of 11.5 Mbits and this results in 86,25 Mbyte transferred in this minute.
In your graph with the last 4 hours of data you can easily use the average value and multiply it with the amount of seconds in the graph and divide it with 8 and you have the total data transferred.
A little bit more problematic it gets after the data is consolidated.
With a default RRD configuration inside CheckMK this happens after 48 hours.
This automatic consolidation is also one reason that such total amount of traffic cannot easily graphed with this system.
One solution would be - export your metrics data to something like InfluxDB and use the available mathematics there to calculate the total amount of data in a self defined time frame.
That’s the only real practical solution i know at the moment.