Hi All,
I’m just testing out the Checkmk Enterprise edition via the OVF virtual appliance.
I’ve got a site built and a few dummy hosts monitored with rules etc.
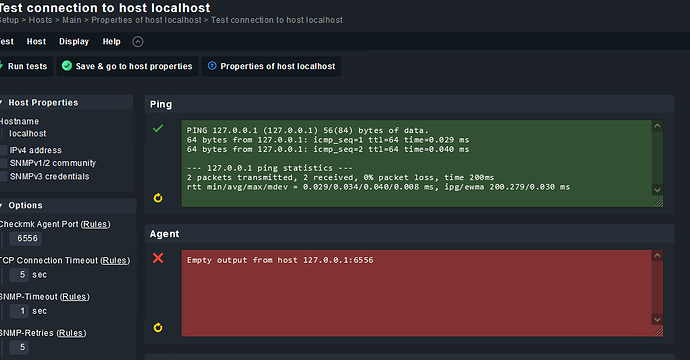
I’m a little confused when I look at the “CheckMK Dashboard” as it’s empty - I expected to see the local CheckMK instance list there - what should be there and if the local host how do I add it?
I also see on the main dashboard none of the graphs are populated, instead the message:
" As soon as you add your Checkmk server to the monitoring, a graph showing the history of your host problems will appear here. Please refer to the Checkmk user guide for more details."
is displayed- however the guide linked doesn’t read well to me - I have a single site but I want to display any host problems within this dashboard widget - why isn’t it looking at it’s own hosts?
If that’s all wrong, how should I monitor the vAppliance CheckMK host itself (to report on storage, memory and cpu usage for the most part I guess)?
And how should I update the main dashboard “problems” graph for hosts managed within the local checkmk site?
Best,
Dave
