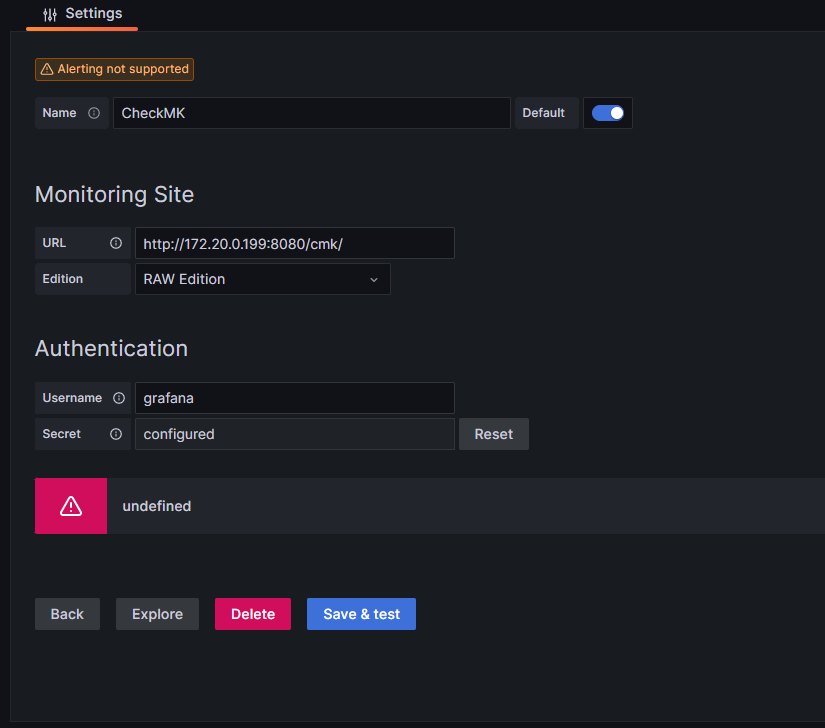
I just can’t get any further and don’t know what else I can do. I am using Docker and have CheckMK Raw (2.1.0p22) and Grafana (9.4.3) as containers. I managed to get the Plug In 2.0.3 installed, but I get a problem when I add the datasource and enter the URL. I am sure that this is correct, but I still get undefined as a message. What is the reason for this?
did you activate the Web API in your CheckMK instance?
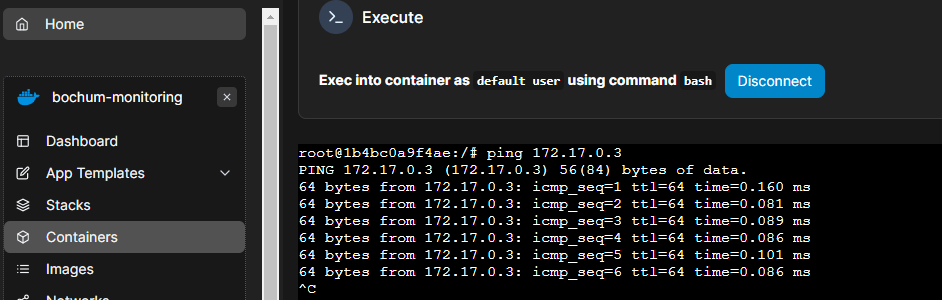
And are you able to get a connection from your grafana container to your checkmk container on port 8080?
thanks in advance for the quick reply. Yes I have unchecked the “Disable Checkmk API” and also when I click on port 8080 I can access my CheckMK container.
This was not possible until recently. I use Portainer as Docker environment and had to enter a public IP under Environment to make it work.
This seems to be now a docker troubleshooting thread
Are the 2 containers sharing the same network?
If you open for example the console of the checkmk container, can you ping your grafana?
I have already tried that as well.
By the way, I noticed that the error message for the proxy only appears when I apparently select a wrong URL. But if I copy the exact URL and paste it into Grafana, I get the message “undefined” in the logs, but there are no further details.
I would be very grateful if you would take the trouble to write me something. I am unfortunately a beginner and would not know how I could do it myself.
@Himbo We have released version 3.0.0beta1 of this plugin. Can you check again with that version?
I don’t fully understand the circumstances that lead to the “undefined” error. Can you explain again so I can check this with the beta version of the plugin and make sure that a better error message is shown in that case?
Thanks!
@BenediktSeidl since I had these issues with running it properly I’m just glad that it works now. But I can try to explain again.
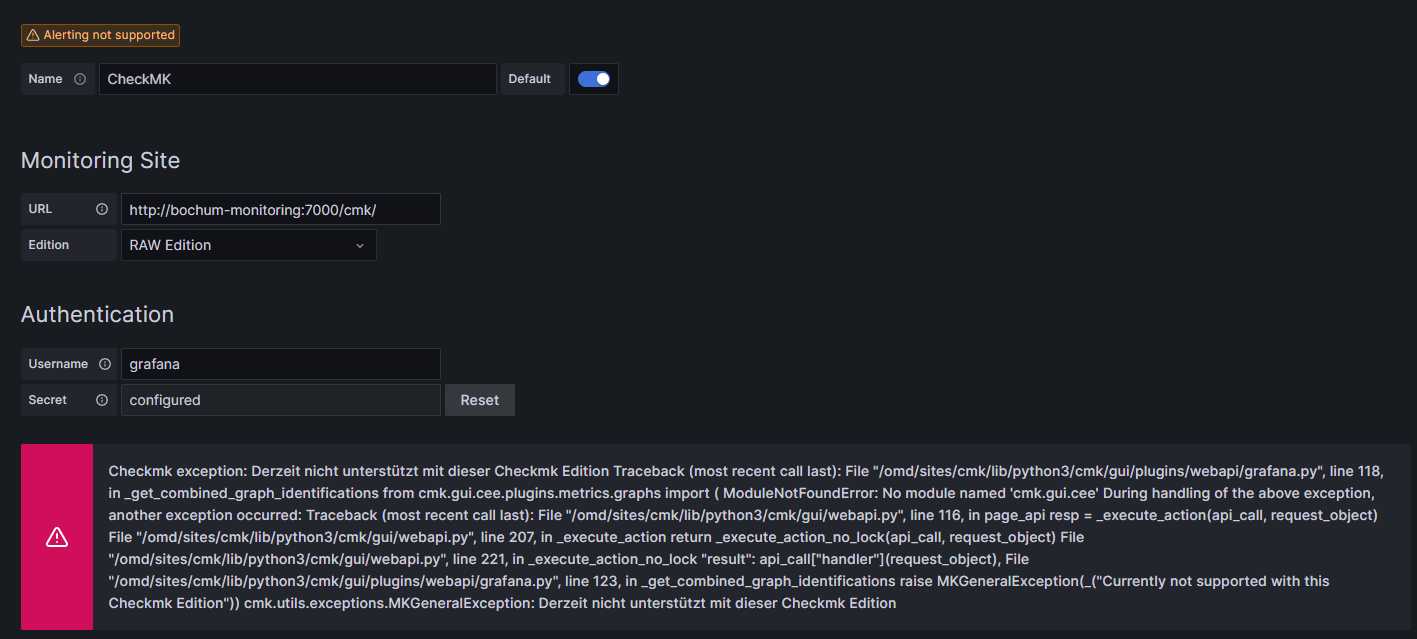
When creating a new automated user in Checkmk, this user must have only normal rights and no admin rights, otherwise I get the undefined message.
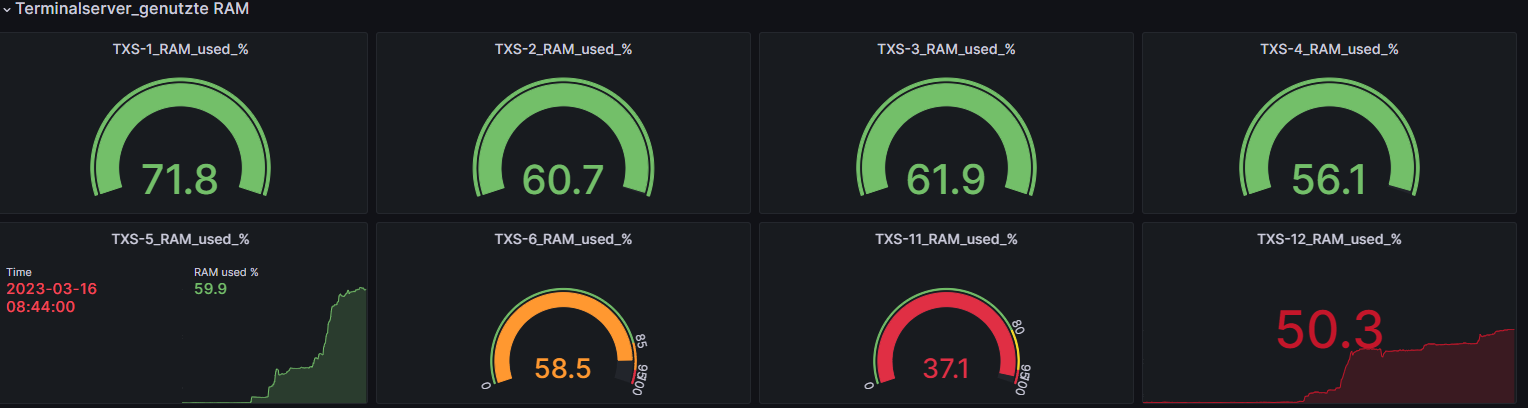
After I have adjusted the rights, the undefined message has also disappeared. Instead I got the message that the version is not compatible. Despite the message I have the datasource in Grafana and can also create dashboards with it, but the created graphs/gauges etc. are not displayed correctly somehow
An example of this, for which I wanted to open an extra thread. The bars are completely off although the used Ram is at e.g. 50-70%.
This topic was automatically closed 365 days after the last reply. New replies are no longer allowed. Contact an admin if you think this should be re-opened.