Hello,
I’m looking for a possibility to built a view in checkmk Enterprise 2.4 with distributed monitoring, showing the number of services per site.
Can anybody help on this?
Thanks in advance.
Sascha
Hello,
I’m looking for a possibility to built a view in checkmk Enterprise 2.4 with distributed monitoring, showing the number of services per site.
Can anybody help on this?
Thanks in advance.
Sascha
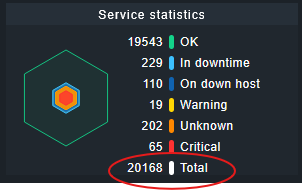
You can use the regex “Site .* statistics” to search for the relevant services.
Thanks for your reply. I’m not sure if we’re talking about the same topic here, correct me if I’m wrong.
I need a view (table) showing the site (customer) and number of services used, next to each other, so comparing the services count from each site statistics of each site in one View.
This is what you need:
Dashboard or Views > System > Checkmk dashboard
or search in Monitor for “Checkmk dashboard“
This is an overview of all Sites including Host and Service counts.
best regards,
Marc
—
By the way, Roberts search shows the same thing, formatted differently but with the same values you are looking for.
Yes, I forgot to mention that #of Services is empty here, so I think thats the view I need, but need the service count as well. And there are only 2 Checkmk servers / 6 sites of 20. I can’t find the source of this information. Is this depending on checkmk agent?
Edit: also the checkmk servers shown in top table are different from the servers shown in sites table.
The CheckMK Agent must be running on the Servers. And the Remote Server need some host labels to appear in some Views:
![]()
At least, the romote server should have the label cmk/check_mk_server:yes.
Thanks for the reply, Marc. I added the labels and the labeled checkmk servers appear in the upper table on checkmk dashboard now, but the servers are still not visible in the buttom table showing # of services. Also the central checkmk server showing version 2.1 here, allthough the Agent version on this server is 2.4. I think this is something I need to look at a little deeper.
But, as I only need the number of services per site, and this information is already available in service statistics on the main dashboard for all, I can’t imagine, it’s that difficult to get this into a simple list/table view showing site and services side-by-side.
Any idea anyone?
Thanks, Sascha
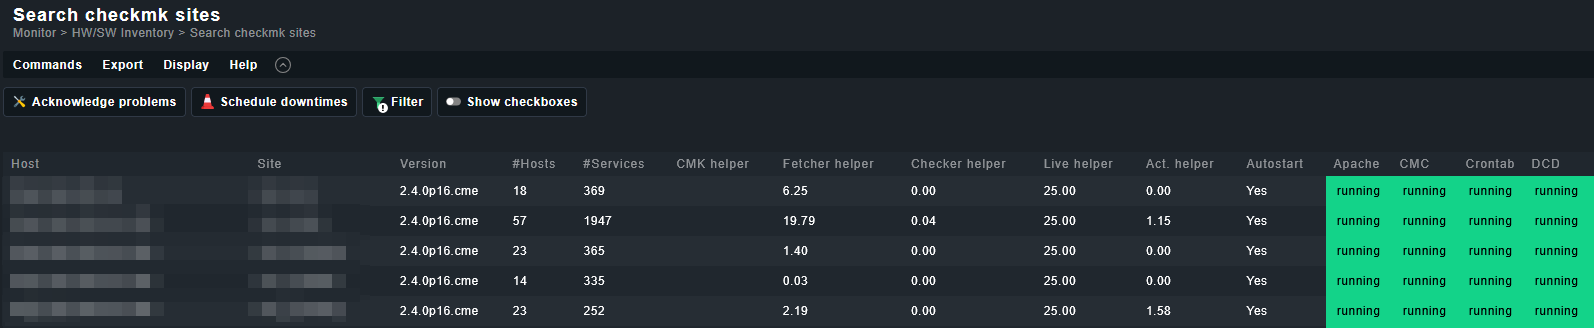
Antoher try:
Monitor > Search checkmk sites
Here you can filter by your CheckMK servers. Another filter may work better for you than the label.
(However, the host label “cmk/check_mk_server:yes” is the only filter used for the views on “Checkmk dashboard,” and this is where your actual problem lies.)
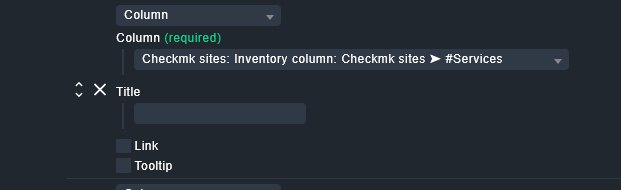
You can also customize the columns with Display > Clone built-in View. The relevant one for you will be:
Kind regards,
Marc
Yes, thats the view from the checkmk dashboard bottom table, but customizable. Thanks for that. I played around with filters here, but, same problem. Even without any filter (reset), I only see two checkmk servers, as on the checkmk dashboard.
One server with 9 different sites and a second server with one site and a site version, but all sites are running on 2.4.0p6.cee. Also only site2, 6 and 8 run on Host1 all other sites on completely different Hosts. Site7 does not exist anymore
For example:
| Host1 | site1 | 2.1.0p20.cee |
|---|---|---|
| Host1 | site2 | 2.1.0p16.cee |
| Host1 | site3 | 2.1.0p16.cee |
| Host1 | site4 | 2.1.0p16.cee |
| Host1 | site5 | 2.1.0p16.cee |
| Host1 | site6 | 2.1.0p16.cee |
| Host1 | site7 | 2.1.0p12.cee |
| Host1 | site8 | 2.1.0p16.cee |
| Host1 | site9 | 2.1.0p20.cee |
| Host2 | site10 | 2.0.0p20.cee |
I don’t understand where this information comes from, as it is obviously old.
Any idea?
Just fixes another problem with the agent on my main server missing automation.secret and now get:
Agent exited with code 1: Traceback (most recent call last):
File “/omd/sites/master/local/lib/python3/cmk_addons/plugins/service_counter/libexec/agent_service_counter”, line 144, in
agent.get_services()
File “/omd/sites/master/local/lib/python3/cmk_addons/plugins/service_counter/libexec/agent_service_counter”, line 138, in get_services
count = len(resp[‘value’])
~~~~^^^^^^^^^
KeyError: ‘value’
Could this be related?