Hi All,
I am facing this issue since I updated to 2.1 and we are up to 2.2.0p35cee now. Agent versions are 2.0.0p33 on linux hosts and the windows hosts 2.2.0p35
I have no problems with the checkmk fetcher helpers on my servers (distributed setup) except for two of them. These two servers have less services and less hosts than the other servers while they have the same configuration as the others. I tried a lot of things and searched the forums. Tried to up the number of helpers to even 500, but no difference. I get no errors in the debug logs.
I am stuck here. Monitoring seems to work reasonable. We tried to up the memory and CPU, but I actually don’t want add anymore, because it just seems to be down to these two and they sure have enough if the others are having no problems at all.
I took one of them out of distribution now to troubleshoot (again…), but nothing seems to have an impact, no matter what I do.
I read the KB article, but that doesn’t seem to help much. A lot I checked already.
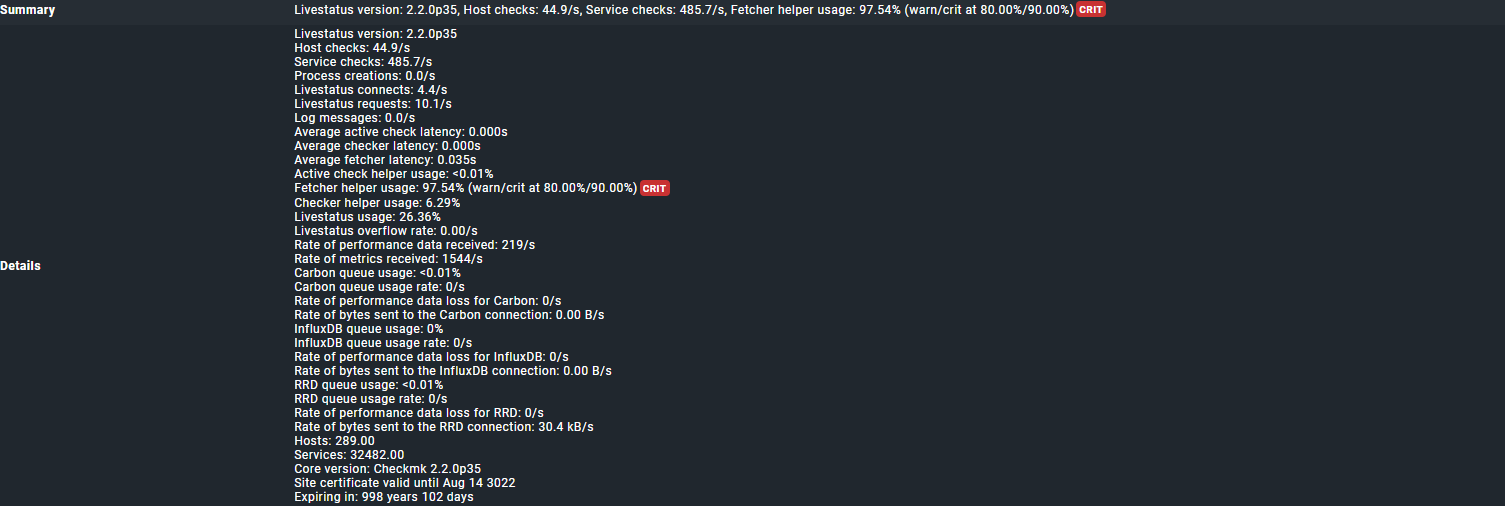
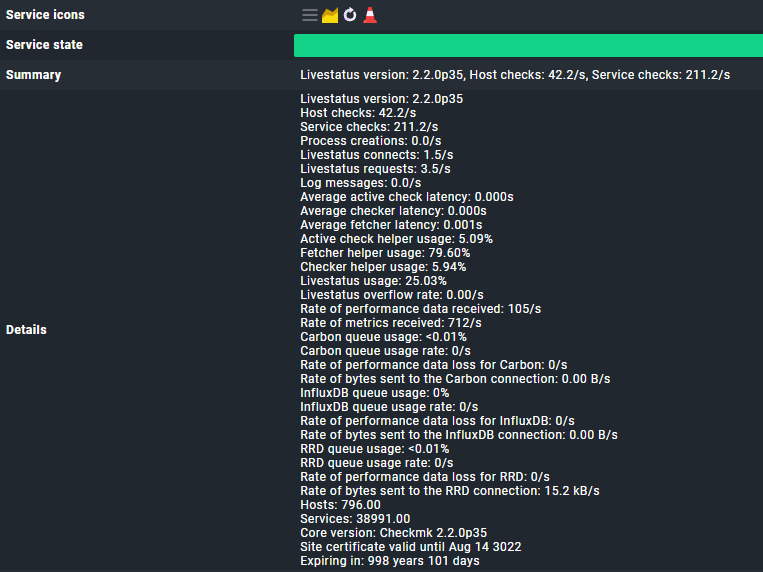
I ran the query for the slow running active checks, but I am not sure what is long?
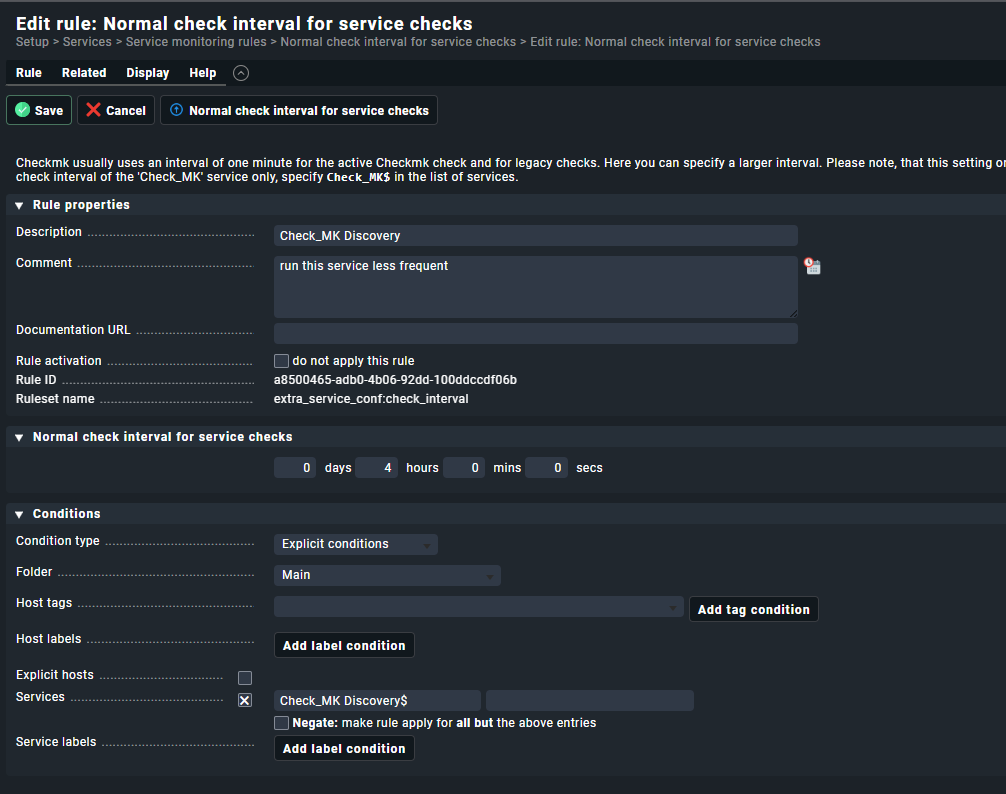
if you see the whole time “Check_MK Discovery” and “Check_MK HW/SW Inventory” checks running - please check the “check interval” for these services. Normally they run only every 2/4/6 hours or so but not at every normal check interval.
You system looks like it runs these checks more often than it is needed.
Also i would inspect the “Check_MK” service runtime if it is not a SNMP device.
Agent devices should not take longer than 1-3 seconds . You screen shows way longer runtimes of the “Check_MK” service. This can lead also to problems.
If I did something wrong or you have some concerns about the above, please let me know. I know my way around, but sometimes get lost in all the options in check_mk, plus I still see myself as a rookie, although I do work with every day
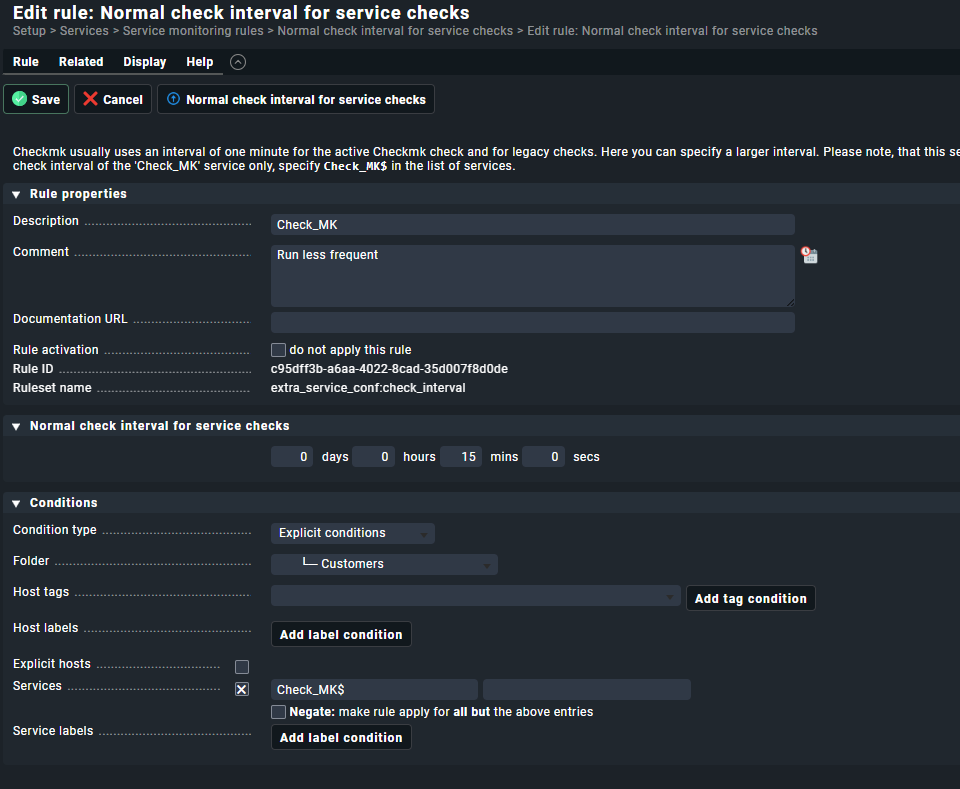
15 minutes check interval for the “Check_MK” service itself is not good as all your services that are passive checks will only be checked every 15 minutes.
As i said i would only check the interval for the “Check_MK Discovery” and the “Check_MK HW/SW Inventory” service.
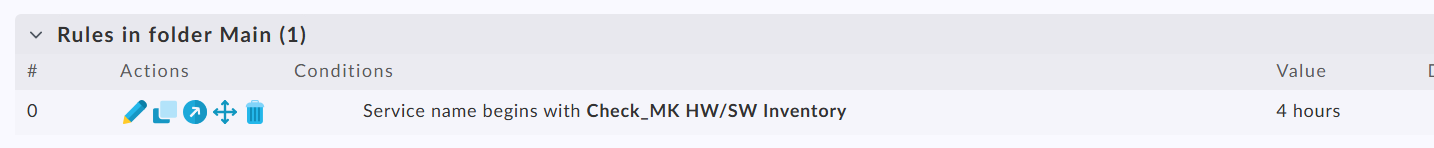
For the HW/SW inventory you should have a rule in your system like here.
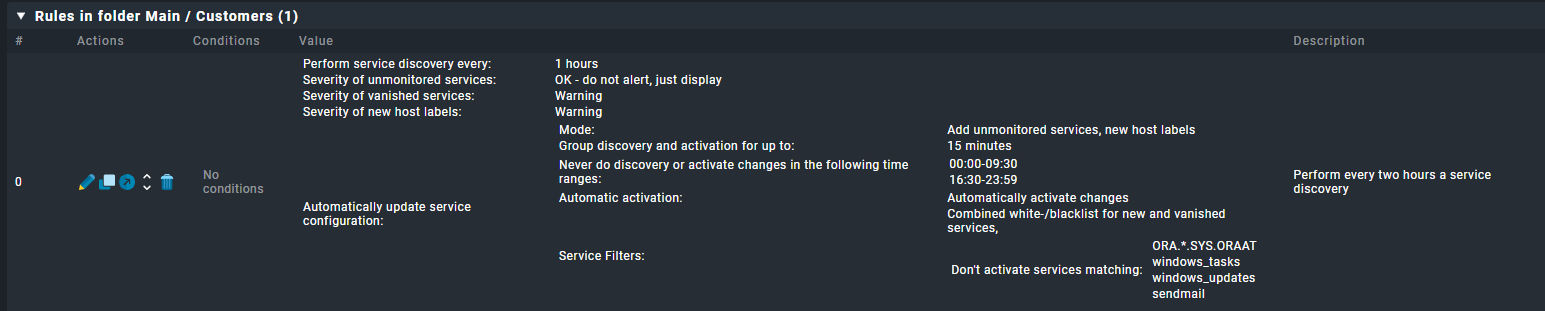
The discovery check interval normally is defined with the rule “Periodic service discovery”.
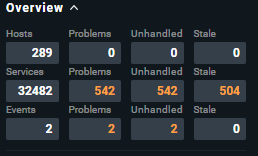
In your last screenshot you have a complete other amount of hosts 796 vs. 289 as before.
With around 800 hosts the 16 cores can also be a little bit low.
Check_MK service runtime around 3 seconds → 3 * 800 = 2400 seconds needed / 16 cores → 150 seconds needed for a full check cycle. With a average runtime of 1 seconds the 16 cores would be enough.
Conclusion: more CPU cores needed for a practical check interval of your services.
I would normally raise the interval to not more than 2 minutes for the services.
For special services you can make an different configuration but the Check_MK service should be in the range 1-3 minutes.
Thanks for that, It’s weird that it shows so much hosts on the omd performance check and says something different on the main dashboard of that site… [edit] the screenshot taken is from the other site I have with the same problem. I will up the CPU
I already had the feeling that the 15 minutes wasn’t really correct. I removed the rule now and the fetcher usage is almost 100% again…
I already had a rule set up for “Check_MK HW/SW Inventory” and that is set to 1 day (not my doing, but it has been like that before I stepped in)
In Periodic service discovery I have a couple of rules, but none of them straight in Main
I think this one has the most impact, but this one I haven’t set up myself as well
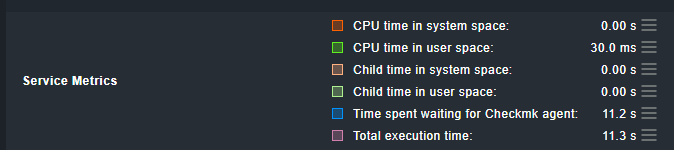
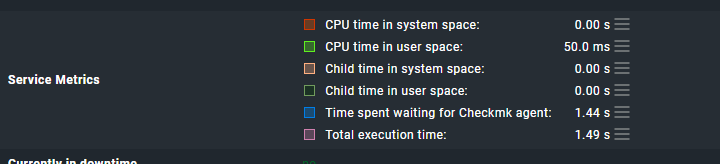
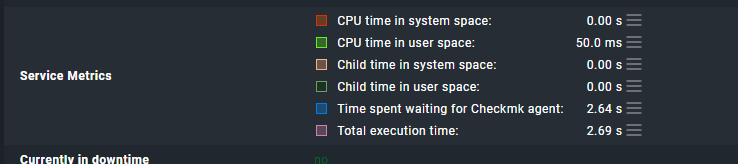
May you check the ‘Time spent waiting for Checkmk agent’ of your check_mk service.
The longer the fetcher needs to fetch the date of your agents the more fetchers are occupied → The higher is the ‘Fetcher Helper Usage’.
I see you have a quite high number of services compared to the number of hosts. Possible you may have some long running plugins?
Also WAN speed sometimes issues run time of fetchers.
I tried to find this ‘Time spent waiting for Checkmk agent’ setting, but can’t find it (or it has not been configured)
Can you please point out where to find or set it?
After sitting with our new support partner, we found the culprit. The global setting for the checkmk fetchers gets overwritten in the site specifics settings in the distributed monitoring set up. We set some more fetchers there and all is OK there. I couldn’t find this in the documentation, maybe it is there somewhere, but…
This topic was automatically closed 365 days after the last reply. New replies are no longer allowed. Contact an admin if you think this should be re-opened.