I have a metric called “Status” which only gets 0 and 2. 0 → OK, 2 → not OK.
I created panel in Grafana and when I check the data arriving from Checkmk
I see values like 0.28, 1.43, 1,78, 0,69. Is it possbile to only gete 0 or 2 because
this are the only values the plugin is crating.
I assume this is the case because Checkmk is interpolating between datapoints.
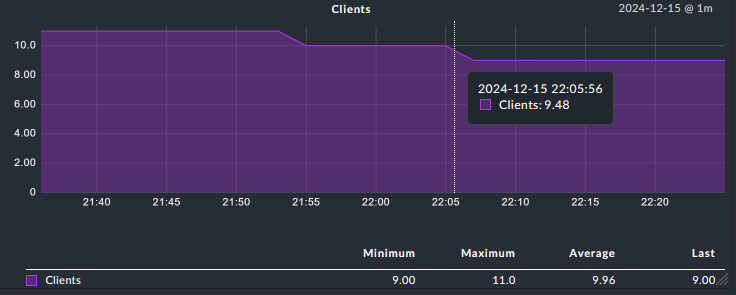
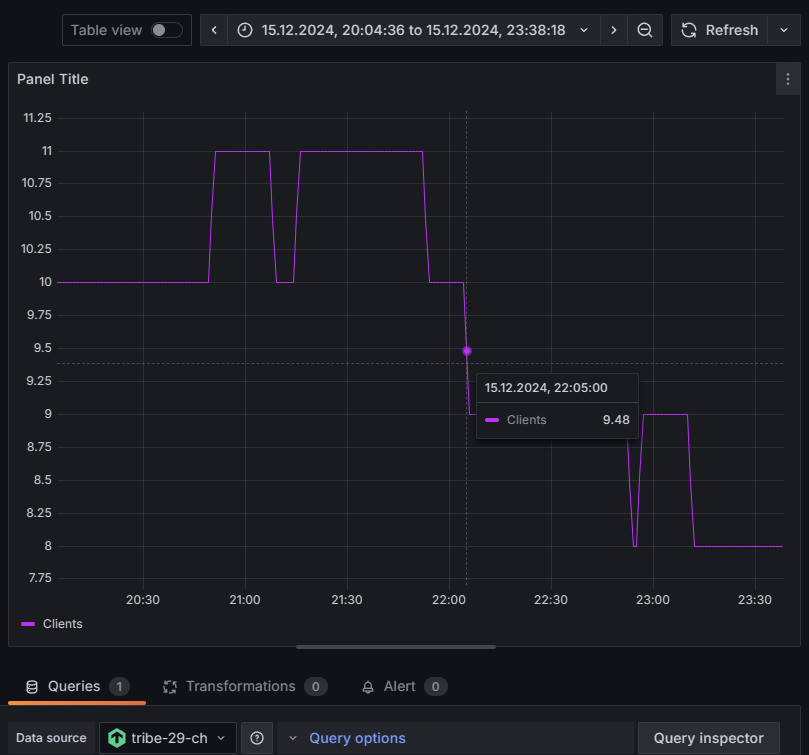
Yeah, I don’t exactly know, but I could imagine it’s not Grafana’s fault. I have a graph of integer values (user count) and it too has interpolation between reads it seems:
Exactly - this here RRDtool - Rates, normalizing and consolidating
is a nice article how data is processed inside RRDTool.
Also the other articles on this side are good to understand the internal things RRDTool does.
thanks for your answers. This is what I assumed.
RRD is developed for timeseries data not status visualitation as specific timestamps like 0 OK and 2 NOK.
This topic was automatically closed 365 days after the last reply. New replies are no longer allowed. Contact an admin if you think this should be re-opened.