Hello to all,
Sorry if the question has already been asked, but I did not find an answer… I use Checkmk combined with Grafana via the native Checkmk plugin. It works well.
However, I don’t understand at all how to display the name of a host or a service as a “Label” in a graph… It stupidly replicates the name of the default metric… Which in my case is useless and counterproductive.
For exemple :
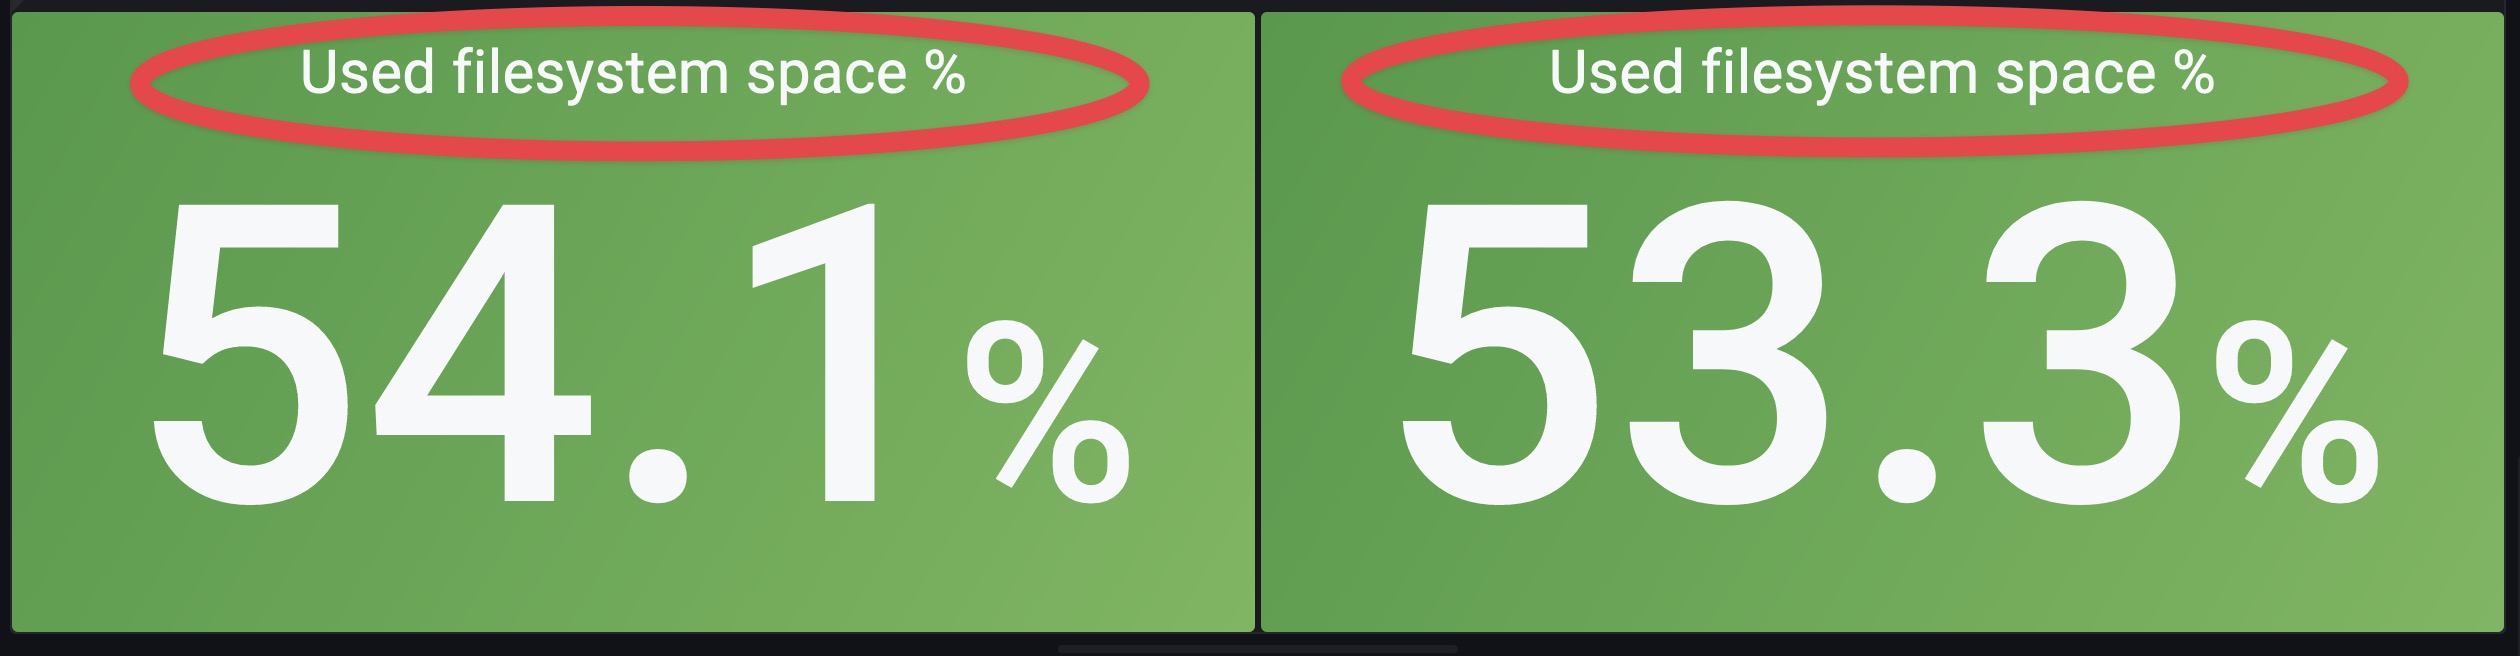
Here for example, it concerns the percentage of use of two different datastores. Ok, it’s the same metric, but how to display for example the name of the host or the datastore concerned instead of the name of the metric ?
I guess it can be done easily ? Thanks for your help !