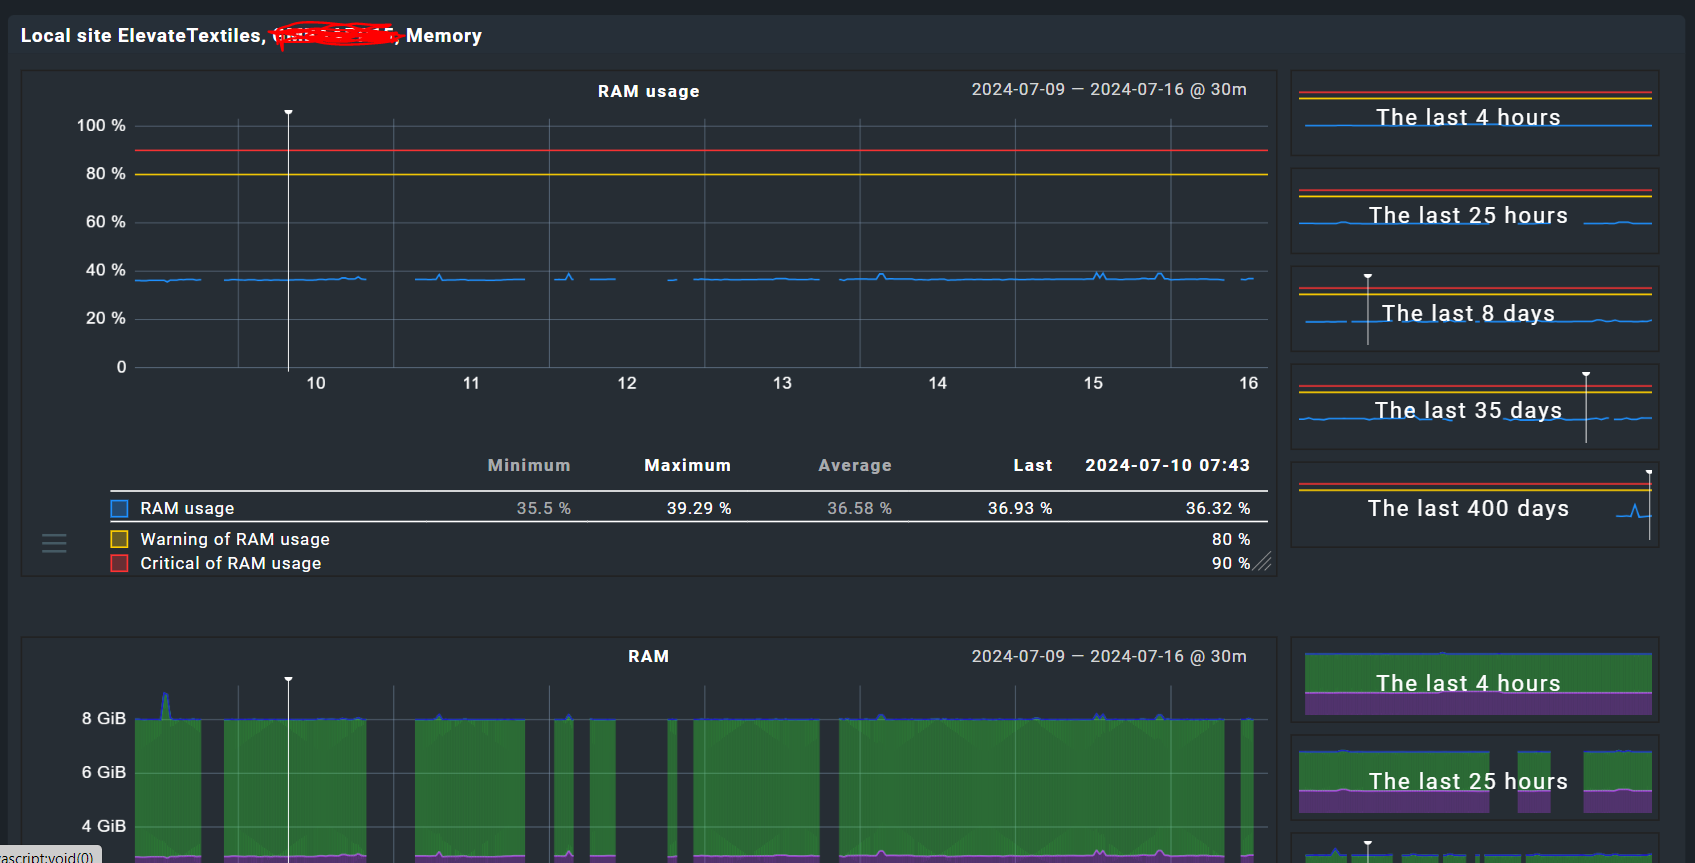
I need your help. I installed the checkmk raw 2.3.0 version . When I want to check the graphs information for any of the devices and for any service I found that graphs are not showing the complete information , some periods of time there is nothing. See the image below:
Hi Armando,
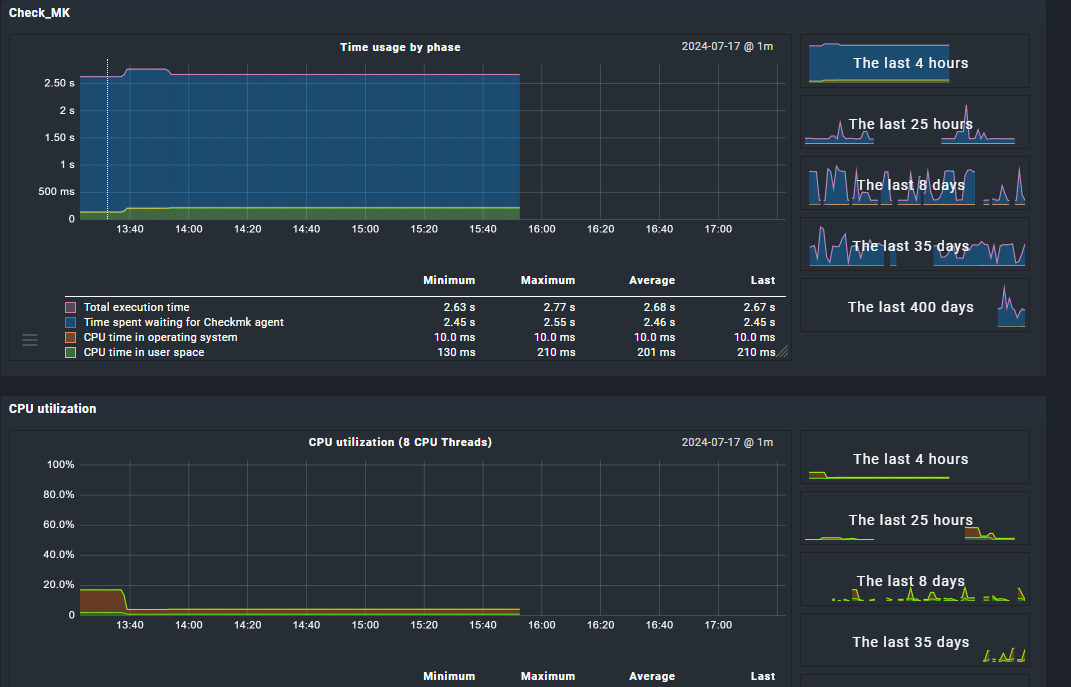
you could check your main agent service. Does it have timeouts from time to time? Then this will be most likely the reason. Also cross-check your other services on the same host. Do they also have missing metrics during the same time?
Sorry Simon , which is my main agent? You mean the agent I have installed in the checkmk server.
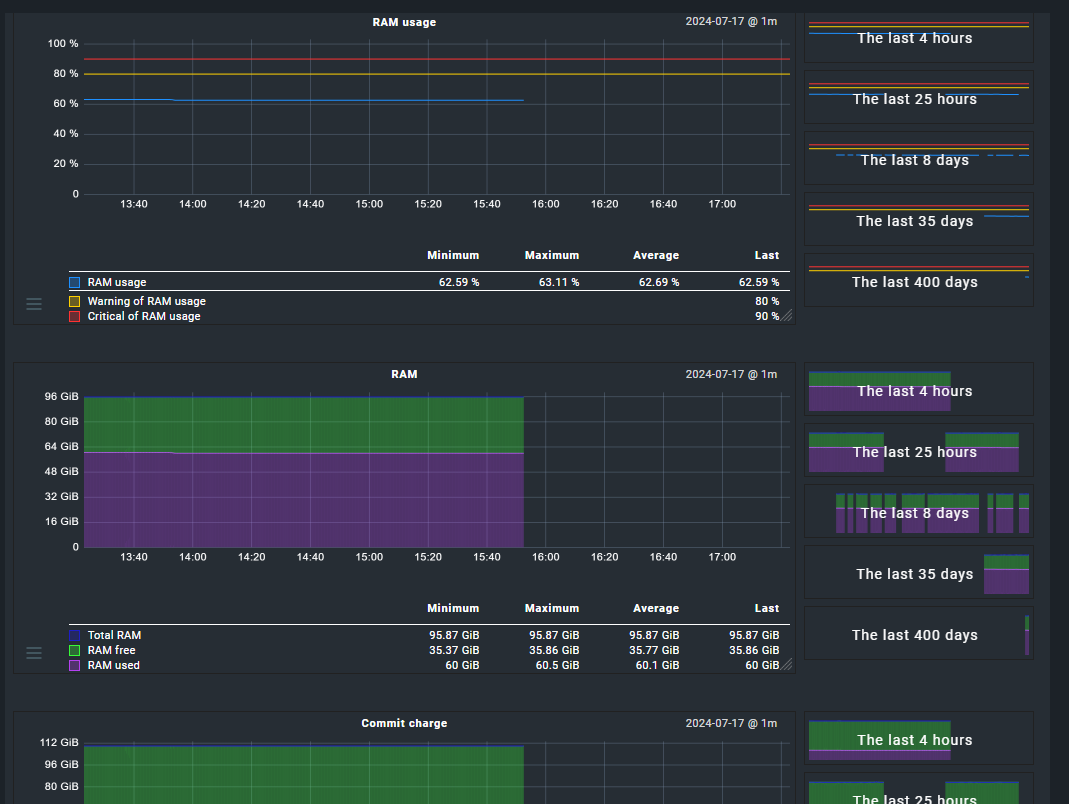
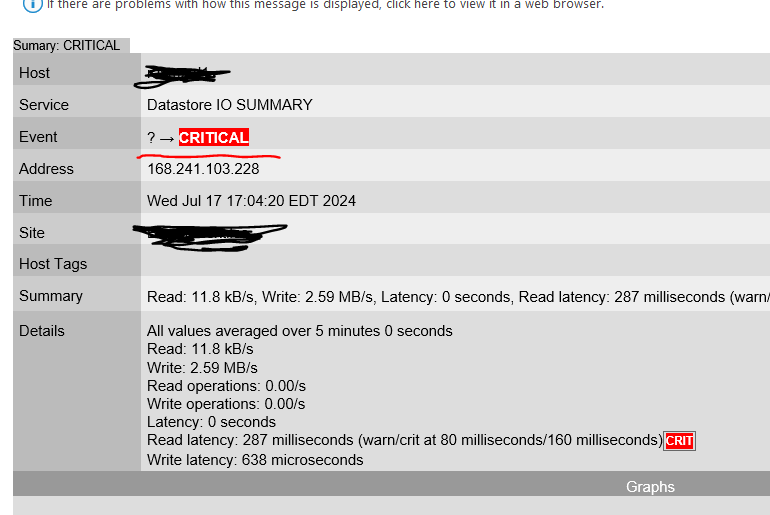
And yes, we are missing metrics on the other services of the same host at the same time (see the image below). The agent is working fine, even is alerting when something goes to critical but the email says “Event: ? ----> Critical” showing an question mark.
If the graphing problem happens for all your monitored devices, then it is probably a problem with your rrdcached / PNP4Nagios backend.
Please have a look at your log files for booth.
This topic was automatically closed 365 days after the last reply. New replies are no longer allowed. Contact an admin if you think this should be re-opened.