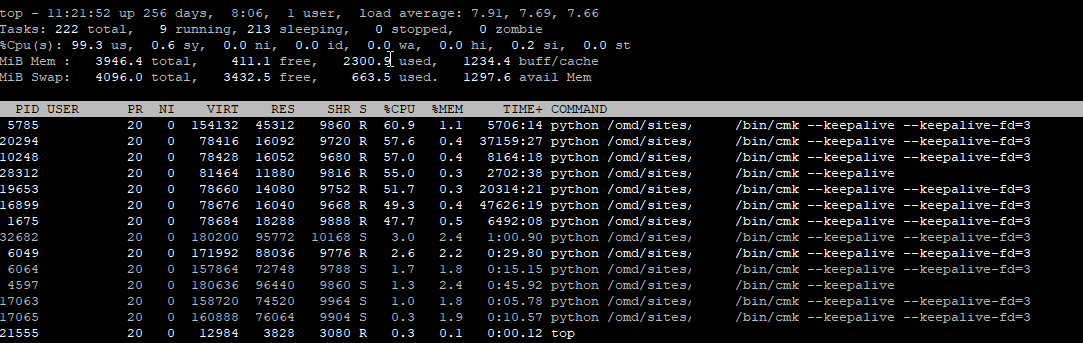
I ran into an issue lately. I see that the monitoring machine is using a lot of CPU. I’m not a Debian expert (it is installed on debian), but i can see a lot of CPU is consumed by python /omd/sites/site/bin/cmk --keepalive --keepalive-fd=3. These processes are almost taking all the CPU power (4 Cores) from the machine.
I’m not monitoring a lot (under 3000 services) so i would like to know if this is normal, or what i can do to troubleshoot this.
Not the number of services is important. It is the number of hosts and your average runtime of all “check_mk” services.
If you make a quick count like this example.
100 hosts with a average runtime of 1 seconds for the “check_mk” service and 1 minute check interval
=> 100 seconds CPU time needed
with 4 CPU’s you have 240 seconds CPU time available per minute and all should run smoothly.
This is a very rough calculation. But it gives a first impression if the system is overloaded or not.
Thanks. I have 97 hosts and 4 CPU’s. So that should be enough is my first thought. I do not changed the check interval, except for a few hosts where i did change the ‘check interval for service checks’ to a less more frequency.
Click on the service Check_MK so its details show up.
On the details page again click on the service name in the 3rd row Service description. Alternatively you can click on the button Service globally in the top row of buttons.
Now you get a list of that service for all hosts. Click the Perf-O-Meter column to sort by runtime.
Basically I agree. But aren’t they just blocking one of the 20 helper processes that run in parallel to query the hosts?
(Btw: I never know which of these do what and the bubble help doesn’t help either. I mean, the Check_MK agent is an active check but I thought the default settings mean that 20 hosts are queried in parallel.)
I have 2 devices which has almost 300 seconds (remote switches on a highly utilized connection). It are SNMP devices, maybe i can tune that better. But when i do not monitor these devices, my CPU is still 100%?
The maximum concurrent checks are default (20 and 5).
In your screenshot it looks like the helper processes are under heavy load.
That’s correct if there are enough CPU resources available.
If one of these helper processes consumes a whole CPU core then you can use in the worst case only 8 parallel processes. But this should be not the normal behavior.
I would say as before that there are problems with the time needed to retrieve the monitoring data from the monitored systems.
I could only say something more with a screenshot of the check_mk service runtimes.
I can agree on this. I used the “micro core statistics”, “Analyze configuration” and stale service to pin down if CheckMK is running good.
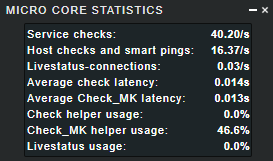
Micro core statistics
Can be found if you go down to the left of you screen to “Add snapin to the sidebar” and select “micro core statistics”
There you view the average latency of you check en Check_MK latency. Next to the check helper and Check_MK helper.
Analyze configuration can we found in you list of “Wato - configuration”
stale service overview can be found top left of your screen in the tactical overview
This way I found out that I had to increase the number of concurrent or move checks to other site. Specially for SNMP checks they can take a while before the SNMP-walk is finished. Increasing helper will increase you memory but decrease CPU usages.
My micro core statistics currently with one snmp device stale:
I can’t see what i can do to decrease my CPU? I have a few SNMP devices on another site which are unreachable a lot for the monitoring (they are up, but monitoring can’t smartping them and they becoming stale). Should i temporarily stop monitoring this hosts to check if this is the reason of my high CPU?