Hi Team,
We are using Checkmk Raw Edition 2.1.0p18, and using Prometheus to monitor our Kubernetes cluster. The Kubernetes cluster is hosted on bare metal.
Since Checkmk can display cluster information on many levels and views like on nodes, pods, containers, namespaces, deployments, and so on. It also displays underlying data about CPU, memory, and file systems to be able to discover utilization that is used by others that k8s on nodes. So that is the reason we want to integrate Prometheus with checkmk.
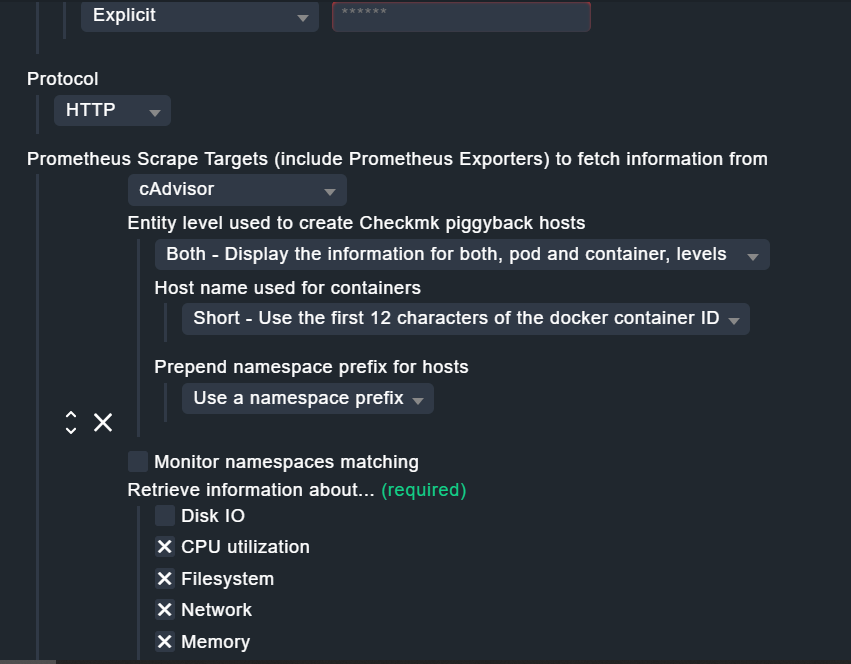
Added rule Prometheus to the instance using Scrape target as cAdvisor. Basic Authentication also done, added root credentials at the moment of Prometheus instance
Also from checkmk server able to ping Prometheus server , and telnet to port 9090 from checkmk server, are any other ports also required?
But still when if I discover services on Prometheus server , nothing appears:(
Please help, which step or configuration am I missing
It would be so interesting to see our Kebernetes environment on checkmk , want it make it happen!!
Please use the native Kubernetes monitoring. Use the Prometheus integration to complement missing information or turn specific queries into Checkmk services. There is no benefit in using the Prometheus integration to monitor Kubernetes vs. the native integration supplied by Checkmk since 2.1.0
Prometheus is not reliable enough in regards to how it is setup, e.g. if you have done any label renaming, which some setups do, then standard queries produce no output.
Thank you for the quick response.
So before using native Kubernetes monitoring , I need to show some stats of Kubernetes on checkmk , the limitations of integration of Prometheus. Some demo needs to be demonstrated to our Platform team and then only we can switch over to native Kubernetes monitoring.
So I am part of Infra team managing checkmk from last 3 years , we have total 666 hosts and 16850 services but this is the first time we got a request using Checkmk for Kubernetes.
Request is below:
Is it possible to use Prometheus data in checkmk?
Integrating Prometheus Integrating Prometheus
The document is taking up that two monitoring ways should not be needed and prometheus data can be used with checkmk. Will this be feasible in a K8s cluster using eric-pm-node-exporter?
Note: Our Container Distribution is not supported checkmk collector of today which will require two ways. Either Container distribution integrates checkmk In their deployment or that other teams covers installation and configuration every time container maiden and upgrade appear. This also implies container config updates that require re-provisioning of nodes.
Sorry for the delay in the reply, will check with the team and let you know.
Any other information you want from us, will put all your questions in one email, as Kubernetes is handled by different team.
If you want to demo the Kubernetes features, then go to play.checkmk.com and do the Kubernetes tour.
But to me, it sounds like consulting or professional support would suit your needs better. This is however not possible for us to deliver to Raw edition users. But you can reach out to one of our Checkmk partners.
Thank you as always for the quick response.
Will start my Kubernetes tour now, in case we need support in setup then we would definitely reach out to you with my team:)
So you want us to eliminate the option of integrating with Prometheus and go with native Kubernetes monitoring?
Hi,
Thank you for the Kubernetes tour, lot of things to discuss with my team and the videos are also crisp and clear.
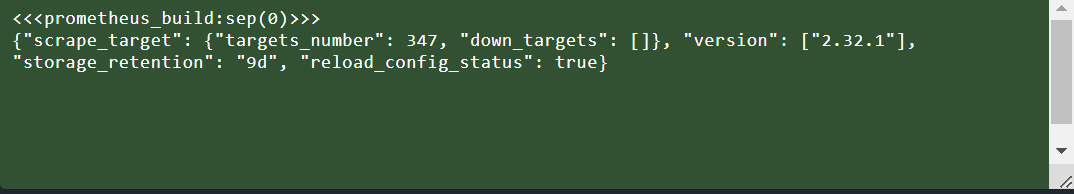
At the moment, I was trying to use Node exporter to get the data from Prometheus, could see billions and trillions of lines in the agent output, but only 1 service monitored is
Please could you help me on above 2 points, as how can we get prometheus data on checkmk.
I understand that native Kubernetes monitoring via checkmk is better than integration with Prometheus but need to show the data and explain the reason through stats as of why the native monitoring is better. Also it’s a decision on management but we need to have some Prometheus data in checkmk.
Yes, if you want to monitor Kubernetes with Checkmk, that is the right way. This is where we will continue to invest and add further features. IMHO the native way is vastly superior to the existing Prometheus integration, which served it’s purpose before we reworked our entire Kubernetes monitoring.
I am not familiar with the nitty-gritty details of the Prometheus monitoring, so I can not help you there. As mentioned, it will be much quicker to go the native way. With Prometheus, there are thousands things which might have gone wrong along the way. Just a simple metric relabeling done will break any default Grafana dashboards, but also any ability for a monitoring tool to digest the metrics incl. Checkmk.
If you want to have Prometheus data in Checkmk, then use either the Prometheus Alert Manager integration which makes a lot of sense for many cases. Or send PromQL queries to get specific data additionally.
I can not help you further in this forum. Your requirements sound like you would be better off with professional services/consulting in this case, as the path you want to go down with Prometheus integration, also requires detailed Kubernetes and Prometheus know-how on your side.
The Checkmk Prometheus special agent delivers its data via the piggyback mechanism. You should be able to find it under ~/tmp/check_mk/piggyback in the site user’s home directory.
To display it in Checkmk, you can either manually create the host objects found in the directory mentioned above, which can be nasty. Or you can add them automatically by using the Checkmk dynamic configuration daemon and piggyback connector, available in the Checkmk Enterprise or Free edition. For the Raw edition, the autopb script fulfils a similar purpose.
Hi,
Thanks a ton!!!
I understood the concept now, how the integration of Prometheus works in Checkmk:)
Now, have the data and stats of Prometheus visible in our Checkmk Raw Edition 2.1.0p18.
Hats off to the checkmk developers!!
Will discuss with my management and development team on native Kubernetes monitoring/upgradation to the CEE version.