I am trying to configure a log file monitoring on a windows server. I want to permanently monitor a specific file for some string.
I created a rule within the Text logfiles (Linux, Windows) for a specific host. After that I created a new agent for this host and installed it.
For me the installation on the host itself looks fine.
The following thinks are present on the windows host:
Logwatch Config is available:
C:\ProgramData\checkmk\agent\config
The config looks like that: # Created by Check_MK Agent Bakery.
**# This file is managed via WATO, do not edit manually or you ** # lose your changes next time when you update the agent.
D:\Test\*.log**
C ERROR
W INFO
O OK
Logwatch Plugin is available:
C:\ProgramData\checkmk\agent\plugins\Logwatch.cfg
A Logwatch State file is generated in the following folder:
C:\ProgramData\checkmk\agent\state\
The state file looks like that for my Test setting:
D:\Test\Test.log|1070|0
However I don’t get this check running. When I do a full scan of the that particular host it doesn’t find any service for the Logfiles. So the check of the logfile on the host seems to be fine but I don’t get the connection to the CheckMK Monitoring Server / Dashboard.
Is there any other setting I might have forgotten?
mk_logwatch.exe → C:\ProgramData\checkmk\agent\plugins logwatch.cfg → C:\check_logfiles (it was complaining about the path when running check_mk_agent.exe test under C:\Program Files (x86)\checkmk\service, so I have set it here, for now), containing the following,
C:\tmp\checkmk.log
 I a
 W world
 C test
checkmk.log → C:\tmp (my test log file) containing the following,
hello
there
world
this
is
a
test
I am not sure what I’m doing wrong, but I have re-scanned the services under the host in question, multiple times, but cannot get it to work, I mean the service for monitoring the log file is not appearing.
When I now run check_mk_agent.exe test under C:\Program Files (x86)\checkmk\service I get,
Also, but maybe that’s just the formatting of the forum, in your logwatch.cfg all “command” lines should start with a space, you in your case it should read something like this:
C:\tmp\checkmk.log
I a
W world
C test
When all in place run something like this from your CheckMK server (as the site user)
nc -v <windows server> 6556
In the output you should see the logwatch section. If that’s the case, the logfile should appear as a service on the host when you do a full service scan.
Worked immediately! I replaced the mk_logwatch.exe file that I had with the one from the link you provided me with and also changed the directory of logwatch.cfg from C:\check_logfiles to C:\ProgramData\checkmk\agent\config, re-scanned the services and it picked it up immediately!
I really appreciate the help, honestly, I have spent the entire day on this, thank you so very much.
do I need to keep the log printing messages in order to get an alert, or am I doing something wrong with the logwatch.cfg file syntax? I do have the space in front of the “command” lines.
Glad that it’s working for you now. If you want to test for the check going in warning or error state, you’ll have to add a message to the log. Logwatch will only react to new messages that appear in the log, thus avoiding reporting on the same messages over and over again.
So, just add a message that would trigger an alert. That should do the trick.
Now I did some further investigations. When launching the agent from the command line in the test mode I can see that it picks up the entries within my Test.log file:
<<>>
[[[C:\Temp\Test.log]]]
C ERROR
<<<>>>
<<>>
When I launch the agent as a windows services the logwatch.state file is created but apparently there no error is reported:
Well, remember, the agent picks up only new messages in the log, after it’s started. So any messages that are already in it are ignored. Add some more messages that should trigger an event when the agent is running.
Then from you CheckMK server run:
nc -v <windows server> 6556
In the output you should see the new messages appearing under <<<logwatch>>>
Never got the chance to reply, got really busy with other projects, apologies.
It’s working fine Louis, thank you. The only thing to figure out currently is how to ignore all strings, say print OK (green) apart from the ones with issue CRIT and WARN.
If you could shed some light, at some point, it would be great, appreciated.
Well it would help if you could share part of the logfile you’re trying to analyse and what you’re hoping to achieve.
But in general the configuration ignores everything except when explicitly specified.And it works on a first match basis. So let’s say I have this in logwatch.cfg:
C:\tmp\checkmk.log
 I error.jsp
 W warning
 C error
And in the checkmk.log you get messages like this:
Now the first one’s easy, it will triggar an error as it matches on the “C error” line. However, the second one will be ignored. Indeed it has the keyword error in it, but it matches “I error.jsp” first. And after the first match logwatch will stop processing and continue to the next line in the logfile, which according to similar logics will trigger a warning.
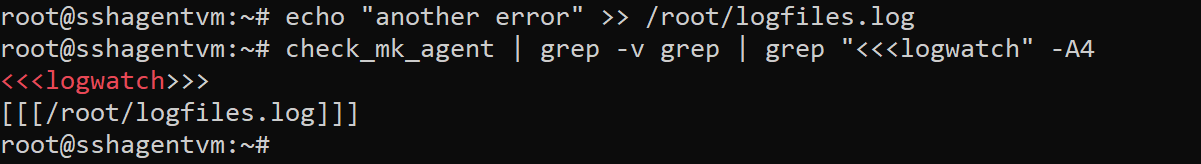
Try something like this with the the enabled: echo "another error" >> /root/logfiles.log
Then see if the service turns to critical in CheckMK as it will only react to errors that are added to the logfile after it’s been added to logwatch. This is to prevent reporting on the same errors over and over again.
Ah sorry, that wasn’t clear from your first post. Well, that’s strange. It should have worked then. And since you’re running as root on the monitored system itself, that rules out access rights as well.
Just out of curiosity, what does this do:
cd /usr/lib/check_mk_agent/plugins/
export MK_CONFDIR=/etc/check_mk/
./mk_logwatch.py
It should display at least the logfiles you want to monitor and all new error messages contained therein. And then, add another line to the logfile and see if that gets printed. At least this should confirm your plugin is working as it should.
root@sshagentvm:/usr/lib/check_mk_agent/plugins# echo "a new other error" >> /root/logfiles.log
root@sshagentvm:/usr/lib/check_mk_agent/plugins# ./mk_logwatch.py
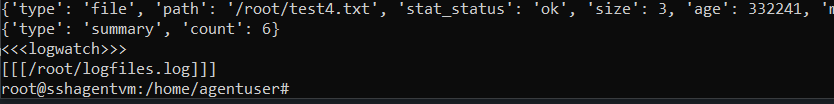
<<<logwatch>>>
[[[/root/logfiles.log]]]
C a new other error
root@sshagentvm:/usr/lib/check_mk_agent/plugins#
Ok, so that confirms at least that the plugin is picking up the changes in the logfile, so that’s good.
So I’m wondering, from the hostname I’m guessing you access the agent via SSH on this server. What user do you use to connect? If it’s root, no problem, if it’s another user, you don’t have access to the logfile, which would explain this.
Now, on my own server I tried running the agent with the grep command you used: /usr/bin/check_mk_agent | grep -v grep | grep "<<<logwatch" -A4
Interestingly enough on my server that comes with a complete empty output. However if I run /usr/bin/check_mk_agent | less
And then search for the logwatch section, I do get it. So, to rule out everything else, add a mathing line to the logfile and then immediately run the agent using the less command. (If you wait too long the host may have been polled by the CheckMK server, and the log entry will not show up anymore).
and the testfiles are created by root so should be ok. /usr/bin/check_mk_agent | less still show nothing. (after adding some new lines)
In my case after executing check_mk_agent the logwatch entry is shown on the buttom…
so without using less or somthing… it still does not show some Strings.
Well, I’m afraid I’m running out of ideas here. Can’t seem to find anything wrong in your configuration and running the mk_logwatch plugin on itself provides the desired output. Without taking an actual look at your systems this is going to be hard.
As for your other question, you don’t (far as I know). That’s the whole idea. After you clear the log in CheckMK you don’t want to see the old errors over and over again.
This topic was automatically closed 365 days after the last reply. New replies are no longer allowed. Contact an admin if you think this should be re-opened.