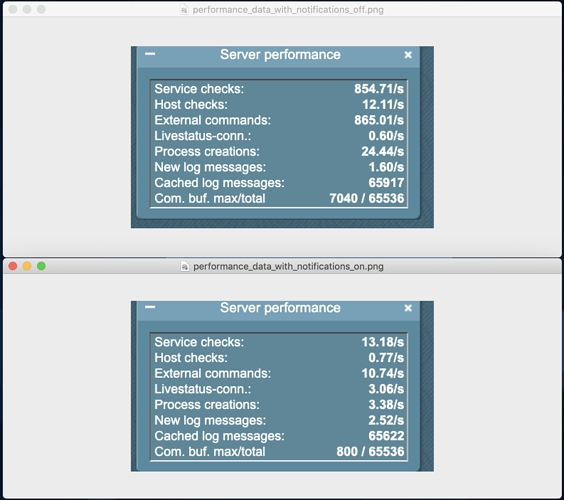
We have a CheckMK Raw instance running in our production env for more than 3 years. We are currently running the following version of CheckMK and Nagios:
CheckMK Raw 1.2.6p16
Nagios Core 3.5.0
We currently use this instance to monitor our production infrastructure by using an external application for running passive checks. We are currently monitoring 1053 hosts and have around ~80k service checks (all are passive checks). The checks are precompiled and are initiated by CheckMK, but are actually executed by an external application. The external application queries the metrics and returns results to CheckMK. CheckMK goes through the results and notification rules and calls the external application again to send out notifications.
We recently ran into an issue where we see very few passive checks being executed when notifications are turned ON through master control in WATO UI and we see checks going back to normal levels when notifications are turned OFF. We initially thought that this was caused by one of the notification rules, but we have ruled that out by disabling all the notification rules and we still see the same behavior. We have also looked at other stats like I/O, CPU and memory and we don’t see any bottleneck there. We have also verified that there are no issues with our external application that’s responsible for running checks.
The behavior we notice when we run top with notifications enabled is that there are very few pre-compiled checks running whereas we see all of the pre-compiled checks running when notifications are disabled. We have captured some performance stats when we see this behavior and we are attaching a screenshot with that data.
Has anyone seen this behavior before? Any help will be greatly appreciated.
Thanks in advance!
