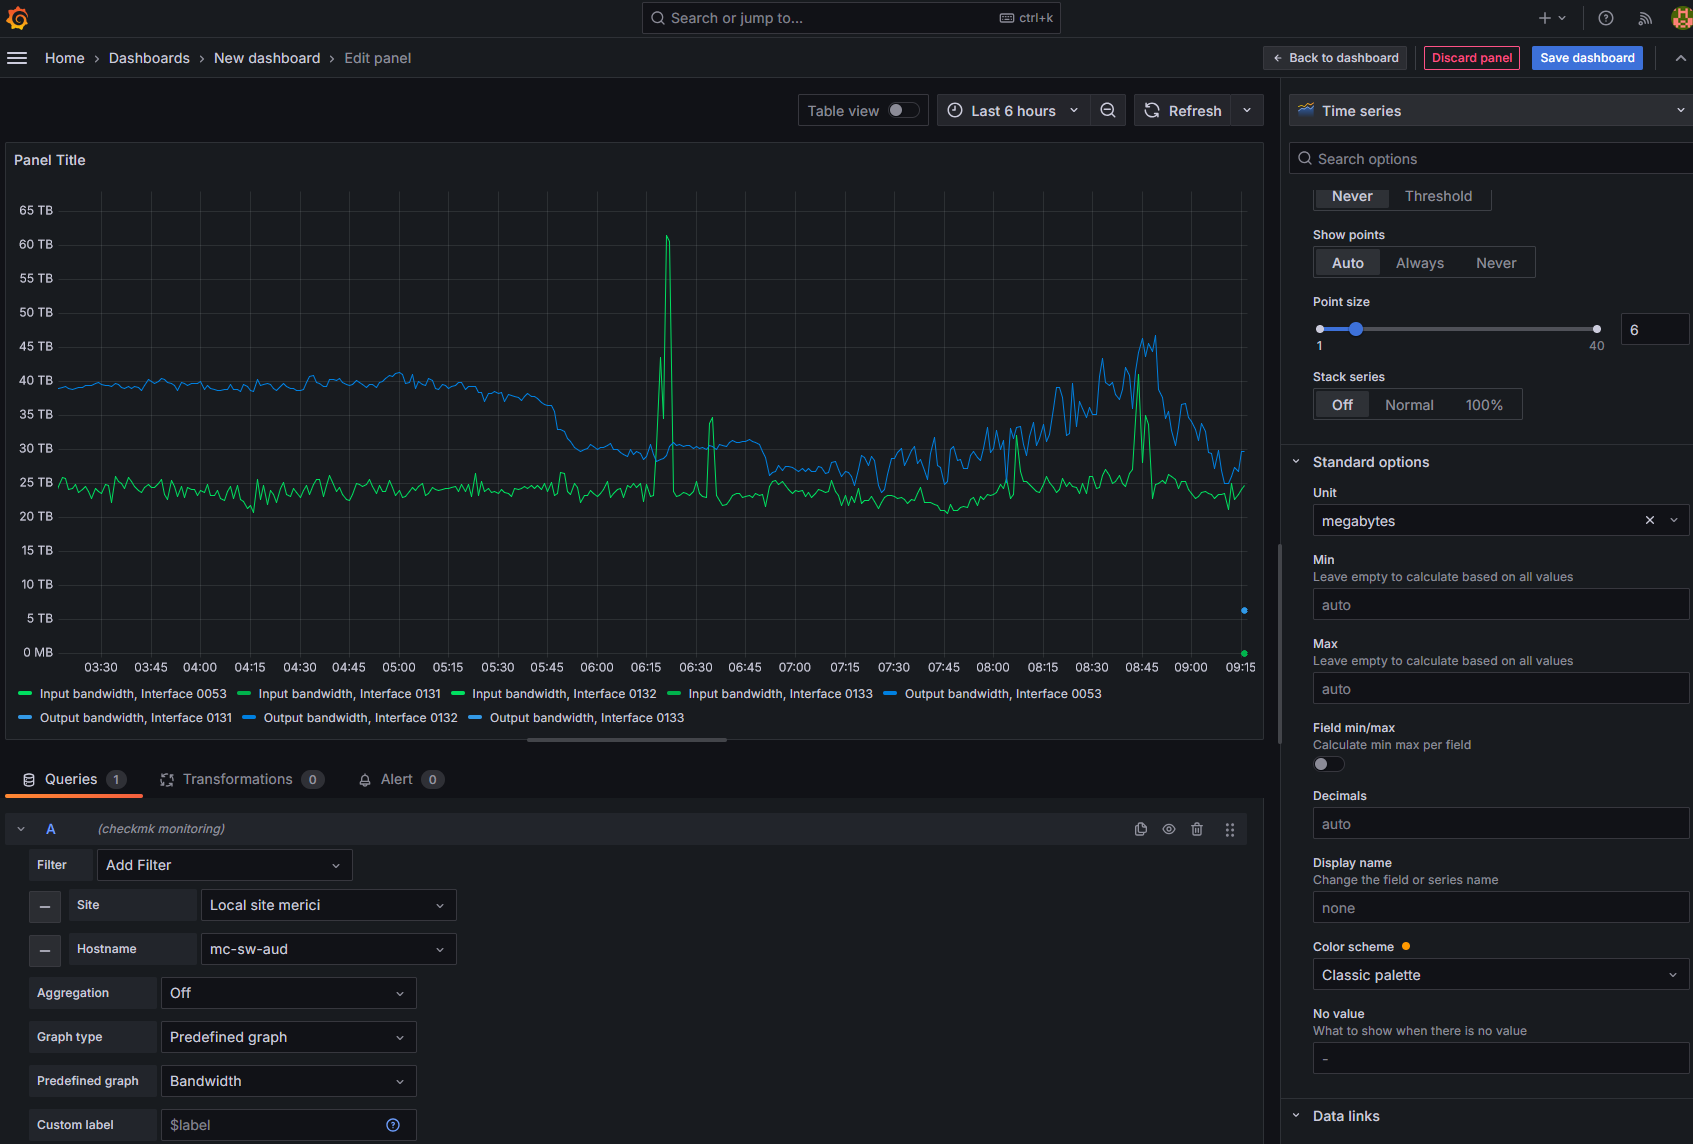
I have connected checkmk cee to Grafana, but when making a dashboard for switches, the data unit of bandwidth is showing incorrectly. I have selected megabytes but it’s showing TB in the graph. I’m not sure what would be the right way to do it. Is anyone facing this issue?
This topic was automatically closed 365 days after the last reply. New replies are no longer allowed. Contact an admin if you think this should be re-opened.