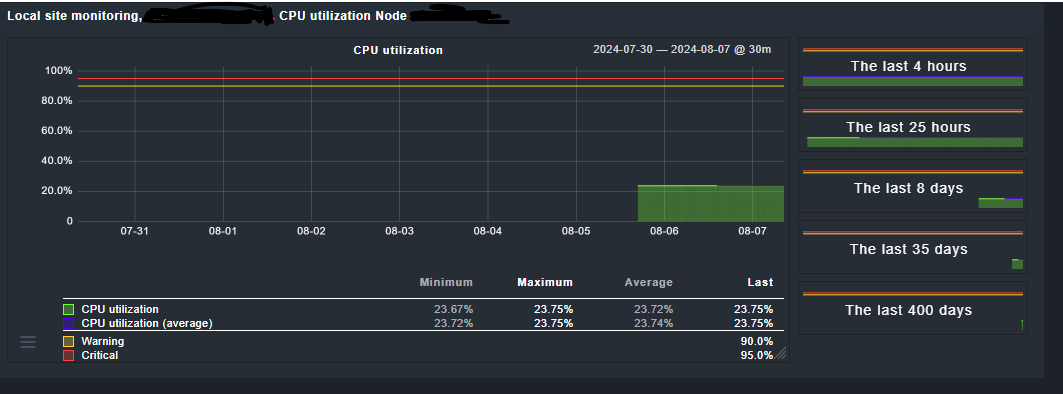
I am trying to use CheckMK 2.3.0p11 Raw to monitor a NetApp on OnTap 9.13 using the special agent and for the most part it works well but the CPU usage on both nodes stays at exactly the same value on each node. I’ve left it running for a few days and I’ve had a variance of about 0.01%.
I’ve run sysstat -M 1 on each cluster node on the cluster and there is a far greater range of CPU usage variance across 5 minutes.
I’m still finding my way around CheckMK so apologies if I am missing something obvious.
Hi Martin,
did you create a cluster object as well as two nodes that are part of it for your Netapp? I have a feeling, that you’re only polling via the cluster ip and then get a reply by only one of the nodes.
I could be wrong though, haven’t had a NetApp between my fingers for some time.
The documentation did refer to using just the cluster IP address so I did that. The odd part is, other metrics are updating correctly such as the CPU core temperature and I am getting the variance you would expect (cooler overnight, warming as the day begins etc) but as far as I can tell the CPU usage is the only one I have found that doesnt change.
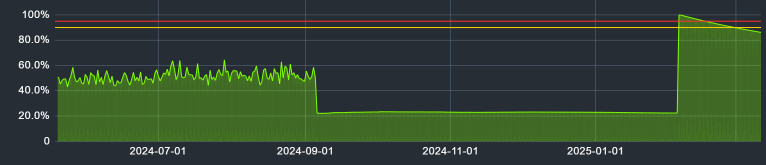
I have the same issue (all values are good, except CPU usage). Sometimes it keeps the same and sometimes (after node reboot) it falls constantly. But always not the real value.
Still the same issues with Ontap9.16.1p5 and checkmk230p35… CPU via snmp is normal, jumps around as expected, but netapp_ontap_cpu shows no correlation with actual cpu load per node. Even on two completely identical clusters, one shows 93% on both nodes, the other shows 4% and 10% which sounds reasonable until you notice that it is always 4% or 10%