Hi, we are curently in the process of migrating our aging CheckMK 1.5 to a new 2.4 Raw Edition. It is installed on 2 12CPU 8GB VMs on SSD Storage.
We have ~20.000 services and never had any performance issues with the old setup.
Currently both systems are checking the hosts with 1.5 CheckMK agents.
We have all data in the new system but experience a load of 50 and stale services. We played around a bit with settings in tuning.cfg but overall it didn’t change much. Right now we have limited the concurrent checks to 80 and a status_update_intervall of 60.
Do you have any advice? Can we expect it to be better once the old system is offline? A quick test by shutting down the old server didn’t change anything we could measure.
Is it possible to split the system in half so we have three sites in the end and share the load between three VMs?
Any tuning options we haven’t tried or heard of? Very thankful for any real world experience and input!
This setting I would limit in maximum to the double number of CPU cores available. Or a little bit lower.
To say more the number of hosts is relevant not the overall services.
It is 450 hosts on the whole setup, around 300 on the relevant site.
I changed the concurrent setting down to 40. Let’s see…Thanks for your reply.
Since we are currently running both, the old 1.5 setup and the new 2.4 CheckMK we are using the old 1.5 agents for compatibility. What would you suggest here? Can this be a bottleneck?
The old agent should not be the problem.
300 hosts → means if your check_mk service runtime is 1 second that you need 5 cores to check all hosts in 1 minute. Respective it will be more cores if the average runtime of the check_mk service is higher.
What should also be controlled is the check interval of the check_mk discovery and hw/sw inventory of active. I had some older systems where the interval was also only 1 minute after upgrade and this is fatal.
HW/SW discovery is not active. There is no rule set. After initial migration I set the discovery to once a day, since I realized this could be a reason for the high load. I was wondering if the symmetric encryption could be an issue but I don’t think so, since the rule was disabled and the old agents don’t support it anyway if I understand correctly.
With your current settings, how high is your CPU load?
If the load is high I would reduce the maximum concurrent checks to 12.
Is there also some timeouts on your check_mk services at the moment? If yes I would first inspect these hosts why the timeout occurs.
We have a load of ~5. Not sure how to check the timeouts in CheckMK raw? Is there a logfile I could look up? I still played with the timeout values, this is what we have right now:
I mean the execution time from the check_mk service. If you select all these services then you should see if there are very high runtimes or timeouts.
The normal timeout in raw edition is 60 seconds.
If you have many check_mk services with high runtimes then this should be investigated.
You mean I should increase the runtime for checks? I looked but couldn’t find a way to add the runtime of the check to the column of stale services for investgation. How can I find out what I am dealing with? Maybe I am blind?
No, only inspect the runtime for all “Check_MK” services. This runtime and the output message can give you hints where the real problem lies.
Normal runtime for these checks should be around 1-2 seconds for normal agents. For SNMP devices it can be higher dependent on the amount of data fetched and the SNMP performance of the queried device.
The stale services are only the result from problems with the Check_MK services as this services produces all the data for the passive services of every host.
Ok, the last sentence cleared it up for me. Now I understand what we are hunting for. We were looking into splitting the site up a bit more and add a third node but maybe if we get the CheckMK Services faster to react we can avoid this.
But I am not really sure how to get the runtimes of the CheckMK services. Can I see this via the frontend? I was not able to add a column or such? Or do I need the cmk command? My RAW edition doesn’t provide this afaik.
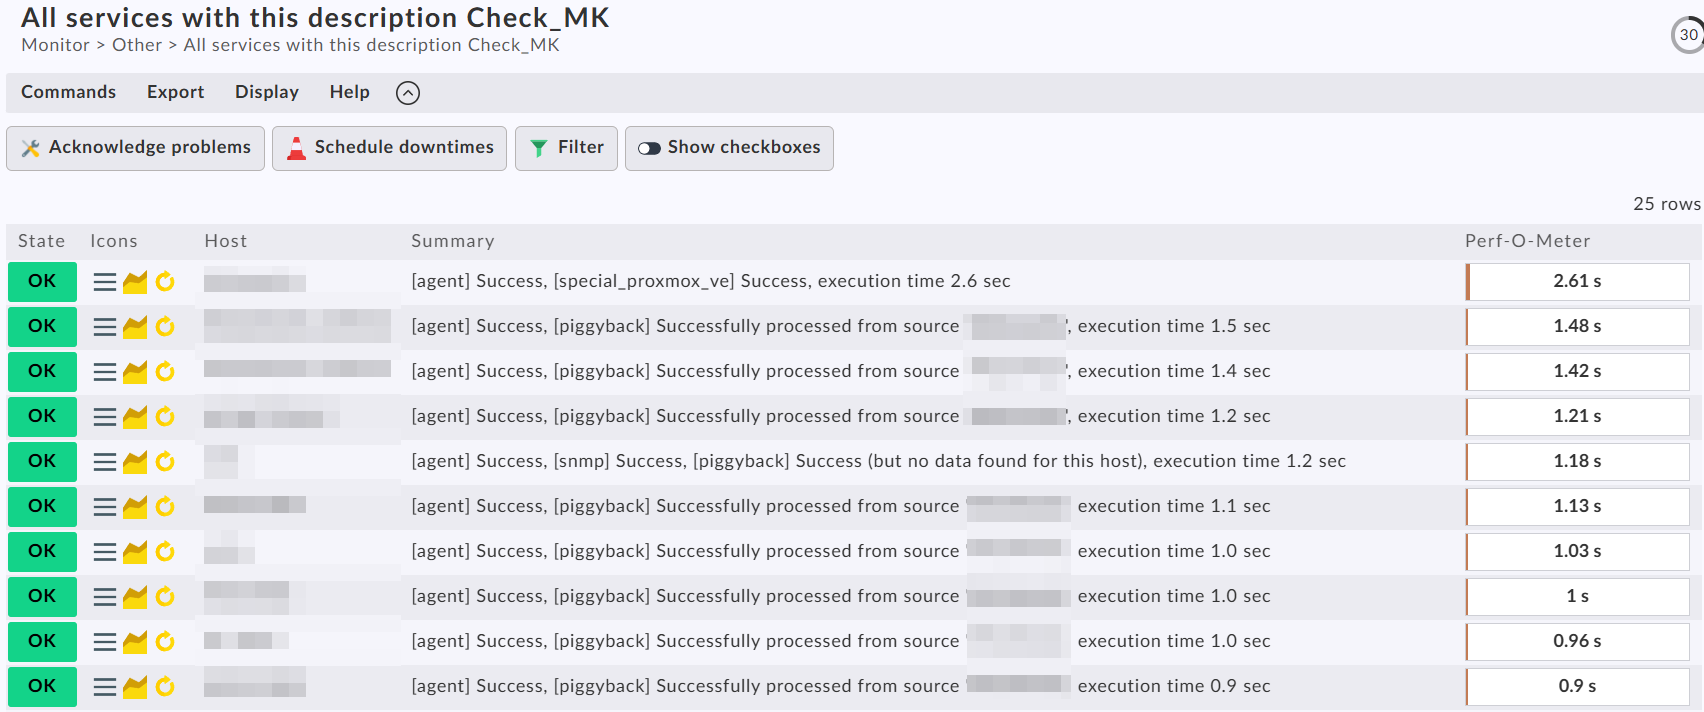
Search for all Check_MK services and sort by the “Perf-O-Meter” column.
Use the “All services with this description …” menu option after you select one of the Check_MK services.
Result looks like this then.
Ok, got it: There are some that take really long, more than 20s. Mostly switches via SNMP. Also quite a few pyhsical servers are above 3-4s. The rest, mostly VMs, seem fine, below 1s. How can I tune from here? What can be possible bottlenecks if not simple CheckMK host resources?
That’s fine - i would only inspect the “check_mk.user.yml” if it is a Windows machine for a proper configuration.
For the switches i would check what takes so long. It is possible that it is completely normal. On command line if you do a “cmk --debug -vvn switchname”, you will see every snmpwalk command and the section name this data is fetched for. If you see here very slow answers for section you don’t need then you can disable these sections with “Enable/Disable SNMP sections” rule.
But do this only with enough caution