CMK version: 2.3.0p41
OS version: Debian 11
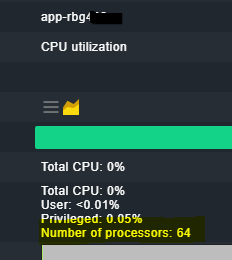
Error message: The concerned Windows servers have 2 CPUs × 36 cores & 72 logical processors as shown below -
DeviceID NumberOfCores NumberOfLogicalProcessors
CPU0 36 72
CPU1 36 72
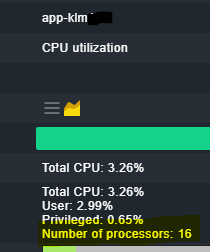
But checkmk is showing no. of processes as 64 in one server and 16 in another server, even though both servers are identical. (refer snippets)
Output of “cmk --debug -vvn hostname”: (If it is a problem with checks or plugins)
OMD[sitename]:~$ cmk --debug -vvn app-rbg
value store: synchronizing
Trying to acquire lock on /omd/sites/sitename/tmp/check_mk/counters/app-rbg
Got lock on /omd/sites/sitename/tmp/check_mk/counters/app-rbg
value store: loading from disk
Releasing lock on /omd/sites/sitename/tmp/check_mk/counters/app-rbg
Released lock on /omd/sites/sitename/tmp/check_mk/counters/app-rbg
Checkmk version 2.3.0p41
- FETCHING DATA
Source: SourceInfo(hostname=‘app-rbg’, ipaddress=‘app-rbg.int.osram-light.com’, ident=‘agent’, fetcher_type=<FetcherType.TCP: 8>, source_type=<SourceType.HOST: 1>)
[cpu_tracking] Start [7f93c8d2e030]
Read from cache: AgentFileCache(app-rbg, path_template=/omd/sites/sitename/tmp/check_mk/cache/{hostname}, max_age=MaxAge(checking=0, discovery=90.0, inventory=90.0), simulation=False, use_only_cache=False, file_cache_mode=6)
Not using cache (Too old. Age is 12 sec, allowed is 0 sec)
Connecting via TCP to app-rbg.int.osram-light.com:6556 (5.0s timeout)
Detected transport protocol: TransportProtocol.TLS
Reading data from agent via TLS socket
Reading data from agent
Detected transport protocol: TransportProtocol.MD5
Try to decrypt output
Closing TCP connection to app-rbg.int.osram-light.com:6556
Write data to cache file /omd/sites/sitename/tmp/check_mk/cache/app-rbg
Trying to acquire lock on /omd/sites/sitename/tmp/check_mk/cache/app-rbg
Got lock on /omd/sites/sitename/tmp/check_mk/cache/app-rbg
Releasing lock on /omd/sites/sitename/tmp/check_mk/cache/app-rbg
Released lock on /omd/sites/sitename/tmp/check_mk/cache/app-rbg
[cpu_tracking] Stop [7f93c8d2e030 - Snapshot(process=posix.times_result(user=0.029999999999999805, system=0.0, children_user=0.0, children_system=0.0, elapsed=0.9800000004470348))]
Source: SourceInfo(hostname=‘app-rbg’, ipaddress=‘app-rbg.int.osram-light.com’, ident=‘piggyback’, fetcher_type=<FetcherType.PIGGYBACK: 4>, source_type=<SourceType.HOST: 1>)
[cpu_tracking] Start [7f93ca034ef0]
Read from cache: NoCache(app-rbg, path_template=/dev/null, max_age=MaxAge(checking=0.0, discovery=0.0, inventory=0.0), simulation=False, use_only_cache=False, file_cache_mode=1)
No piggyback files for ‘app-rbg’. Skip processing.
No piggyback files for ‘app-rbg.int.osram-light.com’. Skip processing.
Get piggybacked data
[cpu_tracking] Stop [7f93ca034ef0 - Snapshot(process=posix.times_result(user=0.0, system=0.0, children_user=0.0, children_system=0.0, elapsed=0.0))]
[cpu_tracking] Start [7f93ca3a2f30] - PARSE FETCHER RESULTS
<<<check_mk>>> / Transition NOOPParser → HostSectionParser
<<<cmk_agent_ctl_status:sep(0)>>> / Transition HostSectionParser → HostSectionParser
<<<wmi_cpuload:sep(124)>>> / Transition HostSectionParser → HostSectionParser
<<>> / Transition HostSectionParser → HostSectionParser
<<>> / Transition HostSectionParser → HostSectionParser
<<fileinfo:sep(124)>> / Transition HostSectionParser → HostSectionParser
<<<winperf_phydisk>>> / Transition HostSectionParser → HostSectionParser
<<<winperf_if>>> / Transition HostSectionParser → HostSectionParser
<<<winperf_processor>>> / Transition HostSectionParser → HostSectionParser
<<>> / Transition HostSectionParser → HostSectionParser
<<df:sep(9)>> / Transition HostSectionParser → HostSectionParser
<<<checkmk_agent_plugins_win:sep(0)>>> / Transition HostSectionParser → HostSectionParser
<<<dotnet_clrmemory:sep(124)>>> / Transition HostSectionParser → HostSectionParser
<<<wmi_webservices:sep(124)>>> / Transition HostSectionParser → HostSectionParser
<<>> / Transition HostSectionParser → HostSectionParser
<<ps:sep(9)>> / Transition HostSectionParser → HostSectionParser
Transition HostSectionParser → NOOPParser
<<<cmk_update_agent_status:cached(1773229736,3600):sep(0)>>> / Transition NOOPParser → HostSectionParser
Transition HostSectionParser → NOOPParser
<<>> / Transition NOOPParser → HostSectionParser
HostKey(hostname=‘app-rbg’, source_type=<SourceType.HOST: 1>) → Add sections: [‘check_mk’, ‘checkmk_agent_plugins_win’, ‘cmk_agent_ctl_status’, ‘cmk_update_agent_status’, ‘df’, ‘dotnet_clrmemory’, ‘fileinfo’, ‘logwatch’, ‘mem’, ‘ps’, ‘services’, ‘systemtime’, ‘uptime’, ‘winperf_if’, ‘winperf_phydisk’, ‘winperf_processor’, ‘wmi_cpuload’, ‘wmi_webservices’]
HostKey(hostname=‘app-rbg’, source_type=<SourceType.HOST: 1>) → Add sections:
Received no piggyback data
CPU utilization Total CPU: 1.12%
Check_MK Agent Version: 2.3.0p41, OS: windows, Last update: 2026-03-10 11:16:54, Agent plug-ins: 1, Local checks: 0
Disk IO SUMMARY Read: 0.00 B/s, Write: 72.0 kB/s, Latency: 58 microseconds
Filesystem C:/ Used: 22.70% - 116 GiB of 512 GiB (warn/crit at 92.16%/94.77% used), trend per 1 day 0 hours: +138 MiB, trend per 1 day 0 hours: +0.03%, Time left until disk full: 8 years 14 days
Filesystem D:/ Used: 1.13% - 34.7 GiB of 2.99 TiB (warn/crit at 94.52%/96.34% used), trend per 1 day 0 hours: -315 MiB, trend per 1 day 0 hours: -0.01%
Interface Intel[R] Ethernet 25G 2P E810-XXV OCP [1], (up), MAC: B4:83:51:05:FE:D1, Speed: 25 GBit/s, In: 708 B/s (<0.01%), Out: 402 B/s (<0.01%)
Interface Intel[R] Ethernet 25G 2P E810-XXV OCP 2 [2], (up), MAC: B4:83:51:05:FE:D0, Speed: 25 GBit/s, In: 4.53 kB/s (<0.01%), Out: 4.16 kB/s (<0.01%)
Interface Remote NDIS Compatible Device [4], (up), MAC: B4:45:06:F0:BC:30, Speed: 426 MBit/s, In: 8.66 B/s (<0.01%), Out: 6.64 B/s (<0.01%)
Memory and pagefile RAM: 7.49% - 19.1 GiB of 255 GiB, Virtual memory: 7.82% - 22.9 GiB of 293 GiB
Processor Queue 15 min load: 0.00, 15 min load per core: 0.00 (144 logical cores)
Service Summary Autostart services: 84, Stopped services: 5
System Time Offset: -1 second
Uptime Up since 2026-02-02 04:24:58, Uptime: 37 days 9 hours
Web Service Default Web Site Connections: 0
No piggyback files for ‘app-rbg’. Skip processing.
No piggyback files for ‘app-rbg.int.osram-light.com’. Skip processing.
[cpu_tracking] Stop [7f93ca3a2f30 - Snapshot(process=posix.times_result(user=0.3599999999999999, system=0.040000000000000036, children_user=0.0, children_system=0.0, elapsed=0.4100000001490116))]
[agent] Success, [piggyback] Success (but no data found for this host), execution time 1.4 sec | execution_time=1.390 user_time=0.390 system_time=0.040 children_user_time=0.000 children_system_time=0.000 cmk_time_agent=0.950
OMD[sitename]:~$
OMD[sitename2]:~$ cmk --debug -vvn app-klm
value store: synchronizing
Trying to acquire lock on /omd/sites/sitename2/tmp/check_mk/counters/app-klm
Got lock on /omd/sites/sitename2/tmp/check_mk/counters/app-klm
value store: loading from disk
Releasing lock on /omd/sites/sitename2/tmp/check_mk/counters/app-klm
Released lock on /omd/sites/sitename2/tmp/check_mk/counters/app-klm
Checkmk version 2.3.0p41 - FETCHING DATA
Source: SourceInfo(hostname=‘app-klm’, ipaddress=‘app-klm.int.osram-light.com’, ident=‘agent’, fetcher_type=<FetcherType.TCP: 8>, source_type=<SourceType.HOST: 1>)
[cpu_tracking] Start [7f886b324170]
Read from cache: AgentFileCache(app-klm, path_template=/omd/sites/sitename2/tmp/check_mk/cache/{hostname}, max_age=MaxAge(checking=0, discovery=90.0, inventory=90.0), simulation=False, use_only_cache=False, file_cache_mode=6)
Not using cache (Too old. Age is 18 sec, allowed is 0 sec)
Connecting via TCP to app-klm.int.osram-light.com:6556 (5.0s timeout)
Detected transport protocol: TransportProtocol.TLS
Reading data from agent via TLS socket
Reading data from agent
Detected transport protocol: TransportProtocol.MD5
Try to decrypt output
Closing TCP connection to app-klm.int.osram-light.com:6556
Write data to cache file /omd/sites/sitename2/tmp/check_mk/cache/app-klm
Trying to acquire lock on /omd/sites/sitename2/tmp/check_mk/cache/app-klm
Got lock on /omd/sites/sitename2/tmp/check_mk/cache/app-klm
Releasing lock on /omd/sites/sitename2/tmp/check_mk/cache/app-klm
Released lock on /omd/sites/sitename2/tmp/check_mk/cache/app-klm
[cpu_tracking] Stop [7f886b324170 - Snapshot(process=posix.times_result(user=0.03000000000000025, system=0.009999999999999981, children_user=0.0, children_system=0.0, elapsed=1.2100000008940697))]
Source: SourceInfo(hostname=‘app-klm’, ipaddress=‘app-klm.int.osram-light.com’, ident=‘piggyback’, fetcher_type=<FetcherType.PIGGYBACK: 4>, source_type=<SourceType.HOST: 1>)
[cpu_tracking] Start [7f886b7cfe60]
Read from cache: NoCache(app-klm, path_template=/dev/null, max_age=MaxAge(checking=0.0, discovery=0.0, inventory=0.0), simulation=False, use_only_cache=False, file_cache_mode=1)
No piggyback files for ‘app-klm’. Skip processing.
No piggyback files for ‘app-klm.int.osram-light.com’. Skip processing.
Get piggybacked data
[cpu_tracking] Stop [7f886b7cfe60 - Snapshot(process=posix.times_result(user=0.0, system=0.0, children_user=0.0, children_system=0.0, elapsed=0.0))]
[cpu_tracking] Start [7f886b326a20] - PARSE FETCHER RESULTS
<<<check_mk>>> / Transition NOOPParser → HostSectionParser
<<<cmk_agent_ctl_status:sep(0)>>> / Transition HostSectionParser → HostSectionParser
<<<wmi_cpuload:sep(124)>>> / Transition HostSectionParser → HostSectionParser
<<>> / Transition HostSectionParser → HostSectionParser
<<>> / Transition HostSectionParser → HostSectionParser
<<fileinfo:sep(124)>> / Transition HostSectionParser → HostSectionParser
<<<winperf_phydisk>>> / Transition HostSectionParser → HostSectionParser
<<<winperf_if>>> / Transition HostSectionParser → HostSectionParser
<<<winperf_processor>>> / Transition HostSectionParser → HostSectionParser
<<>> / Transition HostSectionParser → HostSectionParser
<<df:sep(9)>> / Transition HostSectionParser → HostSectionParser
<<<checkmk_agent_plugins_win:sep(0)>>> / Transition HostSectionParser → HostSectionParser
<<<dotnet_clrmemory:sep(124)>>> / Transition HostSectionParser → HostSectionParser
<<>> / Transition HostSectionParser → HostSectionParser
<<ps:sep(9)>> / Transition HostSectionParser → HostSectionParser
Transition HostSectionParser → NOOPParser
<<<cmk_update_agent_status:cached(1773229830,3600):sep(0)>>> / Transition NOOPParser → HostSectionParser
Transition HostSectionParser → NOOPParser
<<>> / Transition NOOPParser → HostSectionParser
HostKey(hostname=‘app-klm’, source_type=<SourceType.HOST: 1>) → Add sections: [‘check_mk’, ‘checkmk_agent_plugins_win’, ‘cmk_agent_ctl_status’, ‘cmk_update_agent_status’, ‘df’, ‘dotnet_clrmemory’, ‘fileinfo’, ‘logwatch’, ‘mem’, ‘ps’, ‘services’, ‘systemtime’, ‘uptime’, ‘winperf_if’, ‘winperf_phydisk’, ‘winperf_processor’, ‘wmi_cpuload’]
HostKey(hostname=‘app-klm’, source_type=<SourceType.HOST: 1>) → Add sections:
Received no piggyback data
CPU utilization Total CPU: 1.94%
Check_MK Agent Version: 2.3.0p41, OS: windows, Last update: 2026-03-10 11:16:54, Agent plug-ins: 1, Local checks: 0
Disk IO SUMMARY Read: 0.00 B/s, Write: 1.70 MB/s, Latency: 63 microseconds
Filesystem C:/ Used: 41.00% - 211 GiB of 516 GiB (warn/crit at 92.17%/94.78% used), trend per 1 day 0 hours: -156 MiB, trend per 1 day 0 hours: -0.03%
Filesystem D:/ Used: 85.54% - 2.56 TiB of 2.99 TiB (warn/crit at 94.52%/96.34% used), trend per 1 day 0 hours: -1.59 GiB, trend per 1 day 0 hours: -0.05%
Interface Intel[R] Ethernet 25G 2P E810-XXV OCP [4], (up), MAC: B4:83:51:0B:99:B1, Speed: 25 GBit/s, In: 4.53 kB/s (<0.01%), Out: 2.92 kB/s (<0.01%)
Interface Intel[R] Ethernet 25G 2P E810-XXV OCP 2 [5], (up), MAC: B4:83:51:0B:99:B0, Speed: 25 GBit/s, In: 257 B/s (<0.01%), Out: 664 B/s (<0.01%)
Memory and pagefile RAM: 42.91% - 110 GiB of 255 GiB, Virtual memory: 42.54% - 125 GiB of 293 GiB
Processor Queue 15 min load: 0.03, 15 min load per core: 0.00 (144 logical cores)
Service Summary Autostart services: 78, Stopped services: 4
System Time Offset: -556 milliseconds
Uptime Up since 2025-12-22 16:42:45, Uptime: 79 days 3 hours
No piggyback files for ‘app-klm’. Skip processing.
No piggyback files for ‘app-klm.int.osram-light.com’. Skip processing.
[cpu_tracking] Stop [7f886b326a20 - Snapshot(process=posix.times_result(user=0.3599999999999999, system=0.0, children_user=0.0, children_system=0.0, elapsed=0.3999999985098839))]
[agent] Success, [piggyback] Success (but no data found for this host), execution time 1.6 sec | execution_time=1.610 user_time=0.390 system_time=0.010 children_user_time=0.000 children_system_time=0.000 cmk_time_agent=1.170
OMD[sitename2]:~$
Output of the debug command shows the total no. of processes as 144 but it is different is GUI for both the servers.
Need to find out if this is a checkmk issue or if there is some valid reason for this discrepancy.
Kindly assist. Thanks in advance!!