Hey everyone,
I wanted to share a small open-source tool I built that connects CheckMK alerts to an LLM (Claude by Anthropic, or any OpenRouter-compatible model) for automatic root-cause analysis.
The idea
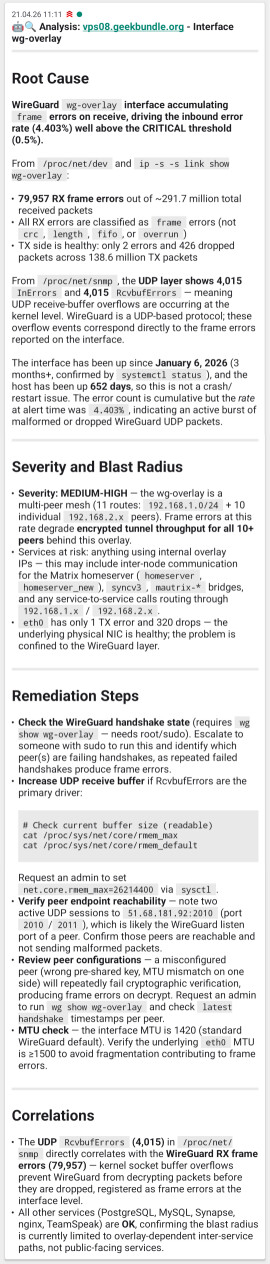
When an alert fires at 3 in the night, a typical manual workflow can be: read the alert, SSH into the host, run a bunch of diagnostic commands, piece things together, figure out what’s wrong. The analyzer can automate part of the diagnostic loop. So instead of doing it yourself, you get a push notification on your phone with a likely cause and suggested remediation steps.
How it works
CheckMK fires a notification ==> a small webhook script forwards it to the analyzer ==> the analyzer queries the CheckMK REST API for current host/service state ==> it then drives an agentic SSH session on the affected host.
The “agentic” part is what makes this interesting: Claude autonomously decides which commands to run (df, free, journalctl, ps, systemctl status, etc.), interprets the output, and decides what to check next, up to a configurable number of rounds (default: 10). It detects the alert category (CPU, disk, memory, service) and tailors its investigation accordingly.
Currently the final analysis is delivered via ntfy as a markdown push notification.
Extensible notification channels
The analyzer uses a simple Publisher interface,Publish(ctx, title, priority, body) + Name(). NtfyPublisher is the built-in implementation, but adding another channel (Slack, Telegram, PagerDuty, email, …) means implementing that interface and passing the instance to the publisher list at startup. Multiple publishers can run in parallel via PublishAll(). The priority field maps to ntfy priority levels and would need a trivial translation for other targets.
You can also provide host-specific context
There’s an optional custom host attribute (ai_context) where you can add operator notes per host, things like “Debian 12, Nginx reverse proxy, config at /etc/nginx/sites-enabled/”, so Claude doesn’t spend SSH rounds figuring out basics.
Security
Since the analyzer SSHs into your hosts on Claude’s behalf, security was a priority:
- Commands run via SSH
exec(argv), not through a shell interpreter - Built-in command denylist blocks destructive/privileged commands (configurable)
systemctlis special-cased: read-only subcommands (status,show,is-active, etc.) are allowed even whensystemctlis otherwise denied- Strict SSH with a pre-populated
known_hostsfile (no trust-on-first-use) - Unpriviledged SSH user is enough. No sudo, no privilege escalation
- Host validation against CheckMK’s host list before any SSH connection
- All gathered output passes through a secret-redaction filter before it reaches the LLM
Also: Kubernetes variant
There’s a sister project,k8s-analyzer,that does the same thing for Alertmanager/Prometheus alerts in Kubernetes clusters. It gathers Prometheus metrics, K8s events, pod status, and pod logs instead of SSH diagnostics.
Both analyzers are separate binaries built from the same codebase and published as container images:
ghcr.io/madic-creates/claude-alert-checkmk-analyzer:latestghcr.io/madic-creates/claude-alert-kubernetes-analyzer:latest
GitHub: https://github.com/madic-creates/claude-alert-analyzer
Happy to answer questions or take feedback. This is a hobby project, but it’s been running reliably in my homelab for a while now.