Hello,
in our BigData world we are using also Cloudera Manager beside MapR as I mentioned in my other topics.
I would like to ask for some hint, how to improve the monitoring.
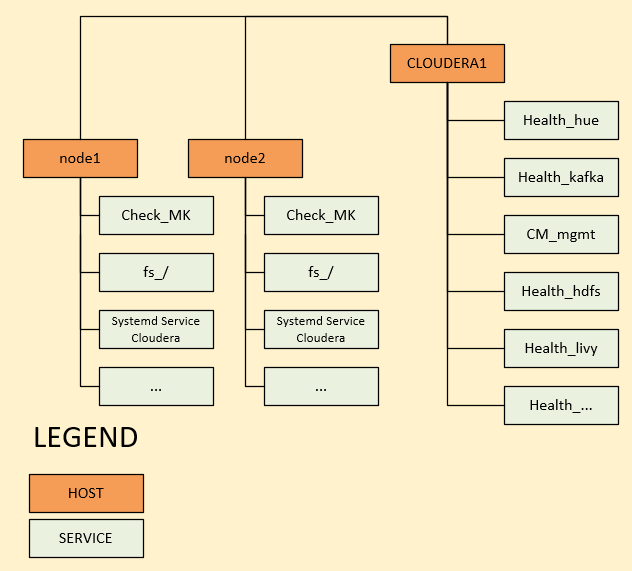
Here is the layout I’ve configured.
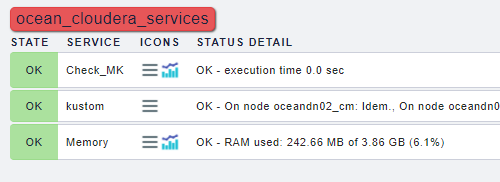
Node1 & Node2 are running same services, on both is installed Cloudera Manager and for checking Cloudera services I’m using HariSekhon plugins. They are pretty good.
On top of that, in Check_MK cluster CLOUDERA1 is created in Clustered Services and I have assigned services to that cluster.
Cloudera Manager is pretty complex SW, running multiple services across multiple datanodes. It has main process “Cloudera” which is serving RESTAPI service. Mentioned plugins are gathering info through this service. Current layout is working pretty fine, we are getting alarms from each service if they fail, and then transoformed as incidents in HP Service Manager 9.
If main process “Cloudera” fails, plugins can’t reach the RESTAPI and they became CRIT. That’s fine, but problem is that in that case we get as many incidents as how many we have services monitored for Cloudera.
I’m scratiching my head, how to figure some kind of hierarchy, dependency on services.
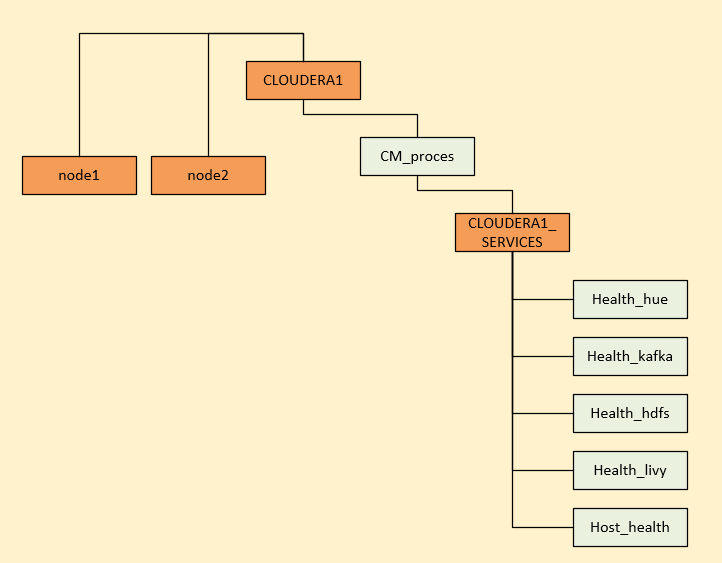
How to make Virtual host(cluster) in Check_MK GUI dependent on some service. Like in second picture. So, if main process “Cloudera” fails, the cluster of services on top of this service will be shown like HOST_DOWN or smething similar therefore no alarms of services under this cluster will be created. Just this one for host.
I tried to make second virtual host in GUI, which will have configured child as first virtual host and first virtual host will have configured child as node1. But that doesn’t work.
Current layout:
Desired layout:
 and define the services, in my case main cloudera process which provides RESTAPI, and set explicit hosts to server1_cm and that’s it.