There is no way to see historical execution time for the Check_MK Discovery Check, is there?
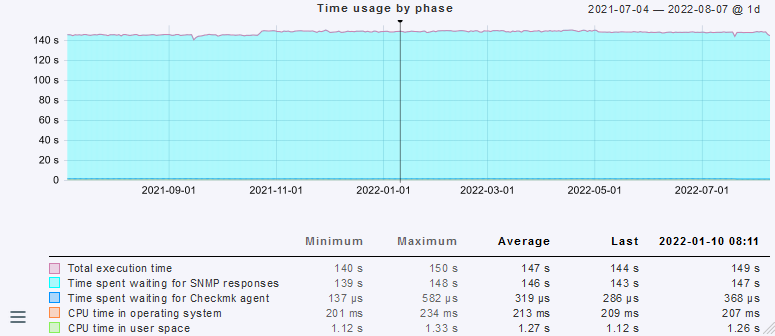
If I use the Check_MK service execution time as approximation it’s obvious that nothing changed before or after the introduction of 2.1:
Also, here’s a screenshot of a subset of “Service check timeout (Microcore)” rules we’ve had (and remained unchanged) for years:
As you can see we set the timeout for the Check_MK and the Discovery service to over 3 minutes, or nearly 4 minutes for the horribly, horribly, horribly slow Juniper EX2200 switches.
This never was an issue for the Check_MK Discovery service status or the Web GUI discovery - in fact, with 2.1, the Check_MK Discovery check still completes successfully just fine thanks to this extension of the default check timeout.
It’s only the Web GUI that aborts prematurely, after exactly 110 seconds, and only since updating to 2.1, for the very same devices that most certainly took way, way longer than 110 seconds for service discovery even with 2.0 (or 1.6, for that matter).
So either the 110 seconds timeout was never enforced in previous versions, whether deliberate or not, or I’m out of ideas.
In any case, I don’t understand what would be the point of such a hardcoded timeout for the automation command - if my device takes 5 minutes to complete a Discover scan, why should I not be able to watch the “Updating” message in my browser for 5 minutes? Precisely the fact that this cutoff only happens if the administrator deliberately and manually wants to kick off a discovery scan (as opposed to the Check_MK Discovery service that runs automatically every $INTERVAL) makes me scratch my head as to the point of it? Is there a point to it?
Also, is there any other way to do what we are now prevented to do thanks to this unwelcome threshold? I’m not aware of any other way to see new, vanished, existing services on the same page, with the button to modify check parameters for any of them before activating changes.
Well, other than cmk -I for the hosts, or auto-modifying the set of services via the automatic service discovery check, and afterwards scrolling through the autochecks file?
By the way, in this case we’re talking about Juniper switches that take more or less linearily more time per active (UP) interface, about 6 seconds per interface, to walk. As these are 48 port switches, a discovery of the standard IF-MIB would take nearly 5 minutes, and that does not include DOM or similar OIDs… Thankfully our switches are not fully utilized…
Even if we could get those to report on cached results of their Broadcom NICs instead of querying them live at the time of polling, we’ve got other devices such as GPON OLT headends with > 100 devices (ONTs) connected, all of them with 4 interfaces or more… All reported via 1 headend - those won’t finish in 110 seconds either, just by virtue of the massive amount of individual SNMP entries in their trees.
EDIT:
With regards to Juniper switches in particular, this was already discussed on checkmk-en in 2015:
and
Looks like a “row-based” querying would solve or alleviate slow SNMP polling for Juniper devices at least, yet I don’t see any way how the current implementation of Checkmk Check API would allow for that. (and indeed it has not been implemented since 2015). Yet, even if Juniper was handled somehow, we’ve got the other devices as mentioned.