[Check_mk (english)] Check_MK, SNMP, Juniper, Help!

So, as Lance pointed out to me once, I know there was a big discussion that took place just before I joined the list. I've read through it, but I'm wondering if there have been any developments. This conversation was in regard to SNMP checks, timeouts, and CPU usage on Juniper devices with Check_MK.

As it stands, now, when I enable interface monitoring (evenly solely on my critical links) the CPU usage goes through the roof and timouts and retries happen all over the place. I have set all of the timers various SNMP checks super low, and have tweaked my SNMP timout and retry values, (currently at 7 seconds with 5 second retry) but it isn't helping much

Let me also say that we are currently using Zenoss AND Infoblox NetMRI, both of which are monitoring these Juniper Switches. Further, when they are turned on they are monitoring EVERY single interface on every juniper switch at 10 minute intervals and they do not cause the above mentioned problems on the switches. I have tried turning them off, and in fact, have them turned off completely on the problem switches and still all of the issues appear when check_mk is monitoring even just a handful of interfaces... This leads me to believe that, indeed there may be something wrong with the juniper checks.

Just trying to get some input, because as it stands I won't be able to use check_mk, unfortunately, because I absolutely love it and want to get rid everything else!

Help!

···

--
Matthew Nickerson
Network Engineer
Computing Facilities, SCS
Carnegie Mellon University
(412) 268-7273
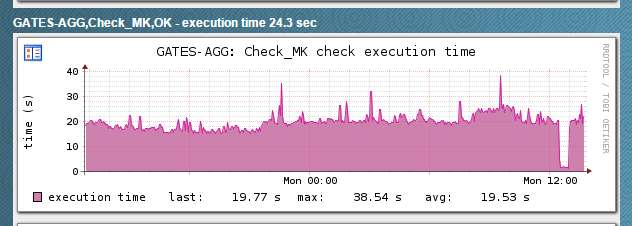
Can someone also please explain what the check called "check_mk" actually does. I know this sounds so stupid, but I can't figure it out. I assume it is a count of how long it takes to complete all of the checks assigned to a given host, maybe? I do know this, when interface monitoring is on, the execution time of this process is increased on average by about 3.5 times on every device. Take a look at the attached photo, of the check_mk execution time. Ythe time when I disabled interface monitoring. Very significant difference. I'm trying to figure out how these two things tie together to troubleshoot this.

Thanks in advance all!

execution.time.jpg

···

On 11/9/2015 1:28 PM, Matthew Nickerson wrote:

So, as Lance pointed out to me once, I know there was a big discussion that took place just before I joined the list. I've read through it, but I'm wondering if there have been any developments. This conversation was in regard to SNMP checks, timeouts, and CPU usage on Juniper devices with Check_MK.

As it stands, now, when I enable interface monitoring (evenly solely on my critical links) the CPU usage goes through the roof and timouts and retries happen all over the place. I have set all of the timers various SNMP checks super low, and have tweaked my SNMP timout and retry values, (currently at 7 seconds with 5 second retry) but it isn't helping much

Let me also say that we are currently using Zenoss AND Infoblox NetMRI, both of which are monitoring these Juniper Switches. Further, when they are turned on they are monitoring EVERY single interface on every juniper switch at 10 minute intervals and they do not cause the above mentioned problems on the switches. I have tried turning them off, and in fact, have them turned off completely on the problem switches and still all of the issues appear when check_mk is monitoring even just a handful of interfaces... This leads me to believe that, indeed there may be something wrong with the juniper checks.

Just trying to get some input, because as it stands I won't be able to use check_mk, unfortunately, because I absolutely love it and want to get rid everything else!

Help!

--
Matthew Nickerson
Network Engineer
Computing Facilities, SCS
Carnegie Mellon University
(412) 268-7273

Hi Matthew,

yes the “Check_MK” service is the only active service pulling all the needed data from the target device. The shown time is the complete runtime to pull the data.

I can remember that there where a discussion so days/weeks before regarding the long runtime of interface checks on Juniper devices.

http://lists.mathias-kettner.de/pipermail/checkmk-en/2015-June/015902.html

The result of this discussion was that Juniper has some stupid SNMP implementation and it is nearly impossible to monitor the complete switch if there are more than some ports on the switch.

Best regards

Andreas

···

Matthew Nickerson mnickers@cs.cmu.edu schrieb am Mo., 9. Nov. 2015 um 20:01 Uhr:

Can someone also please explain what the check called “check_mk”

actually does. I know this sounds so stupid, but I can’t figure it

out. I assume it is a count of how long it takes to complete all of the

checks assigned to a given host, maybe? I do know this, when interface

monitoring is on, the execution time of this process is increased on

average by about 3.5 times on every device. Take a look at the attached

photo, of the check_mk execution time. Ythe time when I disabled

interface monitoring. Very significant difference. I’m trying to figure

out how these two things tie together to troubleshoot this.

Thanks in advance all!

On 11/9/2015 1:28 PM, Matthew Nickerson wrote:

So, as Lance pointed out to me once, I know there was a big discussion

that took place just before I joined the list. I’ve read through it,

but I’m wondering if there have been any developments. This

conversation was in regard to SNMP checks, timeouts, and CPU usage on

Juniper devices with Check_MK.

As it stands, now, when I enable interface monitoring (evenly solely

on my critical links) the CPU usage goes through the roof and timouts

and retries happen all over the place. I have set all of the timers

various SNMP checks super low, and have tweaked my SNMP timout and

retry values, (currently at 7 seconds with 5 second retry) but it

isn’t helping much

Let me also say that we are currently using Zenoss AND Infoblox

NetMRI, both of which are monitoring these Juniper Switches. Further,

when they are turned on they are monitoring EVERY single interface on

every juniper switch at 10 minute intervals and they do not cause the

above mentioned problems on the switches. I have tried turning them

off, and in fact, have them turned off completely on the problem

switches and still all of the issues appear when check_mk is

monitoring even just a handful of interfaces… This leads me to

believe that, indeed there may be something wrong with the juniper

checks.

Just trying to get some input, because as it stands I won’t be able to

use check_mk, unfortunately, because I absolutely love it and want to

get rid everything else!

Help!

Matthew Nickerson

Network Engineer

Computing Facilities, SCS

Carnegie Mellon University

(412) 268-7273


checkmk-en mailing list

checkmk-en@lists.mathias-kettner.de

http://lists.mathias-kettner.de/mailman/listinfo/checkmk-en

Hi, we are still in a situation where we can’t monitor our ex2200s.

Our other tech is trying to push zabbix because of this issue which sucks as check_mk seems alot friendlier to manage. :frowning:

···

On 9 Nov 2015 19:41, “Andreas Döhler” andreas.doehler@gmail.com wrote:

Hi Matthew,

yes the “Check_MK” service is the only active service pulling all the needed data from the target device. The shown time is the complete runtime to pull the data.

I can remember that there where a discussion so days/weeks before regarding the long runtime of interface checks on Juniper devices.

http://lists.mathias-kettner.de/pipermail/checkmk-en/2015-June/015902.html

The result of this discussion was that Juniper has some stupid SNMP implementation and it is nearly impossible to monitor the complete switch if there are more than some ports on the switch.

Best regards

Andreas

Matthew Nickerson mnickers@cs.cmu.edu schrieb am Mo., 9. Nov. 2015 um 20:01 Uhr:

Can someone also please explain what the check called “check_mk”

actually does. I know this sounds so stupid, but I can’t figure it

out. I assume it is a count of how long it takes to complete all of the

checks assigned to a given host, maybe? I do know this, when interface

monitoring is on, the execution time of this process is increased on

average by about 3.5 times on every device. Take a look at the attached

photo, of the check_mk execution time. Ythe time when I disabled

interface monitoring. Very significant difference. I’m trying to figure

out how these two things tie together to troubleshoot this.

Thanks in advance all!

On 11/9/2015 1:28 PM, Matthew Nickerson wrote:

So, as Lance pointed out to me once, I know there was a big discussion

that took place just before I joined the list. I’ve read through it,

but I’m wondering if there have been any developments. This

conversation was in regard to SNMP checks, timeouts, and CPU usage on

Juniper devices with Check_MK.

As it stands, now, when I enable interface monitoring (evenly solely

on my critical links) the CPU usage goes through the roof and timouts

and retries happen all over the place. I have set all of the timers

various SNMP checks super low, and have tweaked my SNMP timout and

retry values, (currently at 7 seconds with 5 second retry) but it

isn’t helping much

Let me also say that we are currently using Zenoss AND Infoblox

NetMRI, both of which are monitoring these Juniper Switches. Further,

when they are turned on they are monitoring EVERY single interface on

every juniper switch at 10 minute intervals and they do not cause the

above mentioned problems on the switches. I have tried turning them

off, and in fact, have them turned off completely on the problem

switches and still all of the issues appear when check_mk is

monitoring even just a handful of interfaces… This leads me to

believe that, indeed there may be something wrong with the juniper

checks.

Just trying to get some input, because as it stands I won’t be able to

use check_mk, unfortunately, because I absolutely love it and want to

get rid everything else!

Help!

Matthew Nickerson

Network Engineer

Computing Facilities, SCS

Carnegie Mellon University

(412) 268-7273


checkmk-en mailing list

checkmk-en@lists.mathias-kettner.de

http://lists.mathias-kettner.de/mailman/listinfo/checkmk-en


checkmk-en mailing list

checkmk-en@lists.mathias-kettner.de

http://lists.mathias-kettner.de/mailman/listinfo/checkmk-en

Maybe a plain old nagios check like check-snmp-netint (I think that is
what it is called) would work. That script does have a lot of
optimizations in it. Last time I used it it wasn't working that great
with Juniper though.

···

--
Patrick Gavin
Systems Administrator
Central IT Systems & Services
Humboldt State University
Email: Patrick.Gavin@humboldt.edu
Phone:(707)826-6058

On Tue, 2015-11-10 at 08:09 +0000, William wrote:

Hi, we are still in a situation where we can't monitor our ex2200s.
Our other tech is trying to push zabbix because of this issue which
sucks as check_mk seems alot friendlier to manage. :frowning:
On 9 Nov 2015 19:41, "Andreas Döhler" <andreas.doehler@gmail.com> > wrote:
Hi Matthew,

yes the "Check_MK" service is the only active service pulling all the
needed data from the target device. The shown time is the complete
runtime to pull the data.
I can remember that there where a discussion so days/weeks before
regarding the long runtime of interface checks on Juniper devices.
http://lists.mathias-kettner.de/pipermail/checkmk-en/2015-June/015902
.html
The result of this discussion was that Juniper has some stupid SNMP
implementation and it is nearly impossible to monitor the complete
switch if there are more than some ports on the switch.

Best regards
Andreas

Matthew Nickerson <mnickers@cs.cmu.edu> schrieb am Mo., 9. Nov. 2015 > um 20:01 Uhr:
> Can someone also please explain what the check called "check_mk"
> actually does. I know this sounds so stupid, but I can't figure it
> out. I assume it is a count of how long it takes to complete all
> of the
> checks assigned to a given host, maybe? I do know this, when
> interface
> monitoring is on, the execution time of this process is increased
> on
> average by about 3.5 times on every device. Take a look at the
> attached
> photo, of the check_mk execution time. Ythe time when I disabled
> interface monitoring. Very significant difference. I'm trying to
> figure
> out how these two things tie together to troubleshoot this.
>
> Thanks in advance all!
>
> On 11/9/2015 1:28 PM, Matthew Nickerson wrote:
> > So, as Lance pointed out to me once, I know there was a big
> discussion
> > that took place just before I joined the list. I've read through
> it,
> > but I'm wondering if there have been any developments. This
> > conversation was in regard to SNMP checks, timeouts, and CPU
> usage on
> > Juniper devices with Check_MK.
> >
> > As it stands, now, when I enable interface monitoring (evenly
> solely
> > on my critical links) the CPU usage goes through the roof and
> timouts
> > and retries happen all over the place. I have set all of the
> timers
> > various SNMP checks super low, and have tweaked my SNMP timout
> and
> > retry values, (currently at 7 seconds with 5 second retry) but it
> > isn't helping much
> >
> > Let me also say that we are currently using Zenoss AND Infoblox
> > NetMRI, both of which are monitoring these Juniper Switches.
> Further,
> > when they are turned on they are monitoring EVERY single
> interface on
> > every juniper switch at 10 minute intervals and they do not
> cause the
> > above mentioned problems on the switches. I have tried turning
> them
> > off, and in fact, have them turned off completely on the problem
> > switches and still all of the issues appear when check_mk is
> > monitoring even just a handful of interfaces... This leads me to
> > believe that, indeed there may be something wrong with the
> juniper
> > checks.
> >
> > Just trying to get some input, because as it stands I won't be
> able to
> > use check_mk, unfortunately, because I absolutely love it and
> want to
> > get rid everything else!
> >
> > Help!
> >
>
> --
> Matthew Nickerson
> Network Engineer
> Computing Facilities, SCS
> Carnegie Mellon University
> (412) 268-7273
>
> _______________________________________________
> checkmk-en mailing list
> checkmk-en@lists.mathias-kettner.de
> http://lists.mathias-kettner.de/mailman/listinfo/checkmk-en
>
_______________________________________________
checkmk-en mailing list
checkmk-en@lists.mathias-kettner.de
http://lists.mathias-kettner.de/mailman/listinfo/checkmk-en
_______________________________________________
checkmk-en mailing list
checkmk-en@lists.mathias-kettner.de
http://lists.mathias-kettner.de/mailman/listinfo/checkmk-en

When it comes down to it, you should probably use the best tool for
the job.
I use Nagios XI for most of my external checks, and Check_MK for
most of
my internal checks, though I’m starting to switch to Check_MK for
some of
the storage (NetApp, Isilon, etc…) since it generates individual
services
and makes it easier to manage larger dynamic installations.

···

On 11/10/2015 03:09 AM, William wrote:

    Hi, we are still in a situation where we can't

monitor our ex2200s.

    Our other tech is trying to push zabbix because of

this issue which sucks as check_mk seems alot friendlier to
manage. :frowning:

    On 9 Nov 2015 19:41, "Andreas D�hler"

<andreas.doehler@gmail.com >
wrote:

Hi Matthew,

          yes the "Check_MK" service is the only active service

pulling all the needed data from the target device. The
shown time is the complete runtime to pull the data.

          I can remember that there where a discussion so

days/weeks before regarding the long runtime of interface
checks on Juniper devices.

http://lists.mathias-kettner.de/pipermail/checkmk-en/2015-June/015902.html

          The result of this discussion was that Juniper has some

stupid SNMP implementation and it is nearly impossible to
monitor the complete switch if there are more than some
ports on the switch.

Best regards

Andreas

Matthew Nickerson < >
schrieb am Mo., 9. Nov. 2015 um 20:01�Uhr:

            Can someone also please explain

what the check called “check_mk”

            actually does.� I know this sounds so stupid, but I

can’t figure it

            out.� I assume it is a count of how long it takes to

complete all of the

            checks assigned to a given host, maybe? I do know this,

when interface

            monitoring is on, the execution time of this process is

increased on

            average by about 3.5 times on every device. Take a look

at the attached

            photo, of the check_mk execution time.� Ythe time when I

disabled

            interface monitoring.� Very significant difference. I'm

trying to figure

            out how these two things tie together to troubleshoot

this.

            Thanks in advance all!


            On 11/9/2015 1:28 PM, Matthew Nickerson wrote:

            > So, as Lance pointed out to me once, I know there

was a big discussion

            > that took place just before I joined the list.�

I’ve read through it,

            > but I'm wondering if there have been any

developments. This

            > conversation was in regard to SNMP checks,

timeouts, and CPU usage on

            > Juniper devices with Check_MK.

            >

            > As it stands, now, when I enable� interface

monitoring (evenly solely

            > on my critical links) the CPU usage goes through

the roof and timouts

            > and retries happen all over the place.� I have set

all of the timers

            > various SNMP checks super low, and have tweaked my

SNMP timout and

            > retry values, (currently at 7 seconds with 5 second

retry) but it

            > isn't helping much

            >

            > Let me also say that we are currently using Zenoss

AND Infoblox

            > NetMRI, both of which are monitoring these Juniper

Switches. Further,

            > when they are turned on they are monitoring EVERY

single interface on

            > every juniper switch at 10 minute intervals and�

they do not cause the

            > above mentioned problems on the switches.� I have

tried turning them

            > off, and in fact, have them turned off completely

on the problem

            > switches and still all of the issues appear when

check_mk is

            > monitoring even just a handful of interfaces...�

This leads me to

            > believe that, indeed there may be something wrong

with the juniper

            > checks.

            >

            > Just trying to get some input, because as it stands

I won’t be able to

            > use check_mk, unfortunately, because I absolutely

love it and want to

            > get rid everything else!

            >

            > Help!

            >


            --

            Matthew Nickerson

            Network Engineer

            Computing Facilities, SCS

            Carnegie Mellon University

            (412) 268-7273

            checkmk-en mailing list

            checkmk-en@lists.mathias-kettner.de

            [http://lists.mathias-kettner.de/mailman/listinfo/checkmk-en](http://lists.mathias-kettner.de/mailman/listinfo/checkmk-en)
      _______________________________________________

      checkmk-en mailing list

      checkmk-en@lists.mathias-kettner.de

      [http://lists.mathias-kettner.de/mailman/listinfo/checkmk-en](http://lists.mathias-kettner.de/mailman/listinfo/checkmk-en)
_______________________________________________
checkmk-en mailing list

mnickers@cs.cmu.edu
checkmk-en@lists.mathias-kettner.dehttp://lists.mathias-kettner.de/mailman/listinfo/checkmk-en

If it comes to classic interface checks take a look at check_nwc_health from Consol.
This is one of the best approaches to checking all the different types of network devices with only one classic check.

I use this for some remote devices on very limited bandwidth and it is working without problem, with check_mk interface checks there are too many timeouts over this wan connection. With the next innovation releases comes an option to only pull selected interfaces from a network device with check_mk. This will make then such constructs obsolete.

Best regards

Andreas

···

Jam Mulch spammagnet10@gmail.com schrieb am Di., 10. Nov. 2015 um 17:41 Uhr:

When it comes down to it, you should probably use the best tool for

the job.

I use Nagios XI for most of my external checks, and Check_MK for

most of

my internal checks, though I'm starting to switch to Check_MK for

some of

the storage (NetApp, Isilon, etc...) since it generates individual

services

and makes it easier to manage larger dynamic installations.

On 11/10/2015 03:09 AM, William wrote:

    Hi, we are still in a situation where we can't

monitor our ex2200s.

    Our other tech is trying to push zabbix because of

this issue which sucks as check_mk seems alot friendlier to
manage. :frowning:

    On 9 Nov 2015 19:41, "Andreas Döhler" > > <andreas.doehler@gmail.com        > > > wrote:

Hi Matthew,

          yes the "Check_MK" service is the only active service

pulling all the needed data from the target device. The
shown time is the complete runtime to pull the data.

          I can remember that there where a discussion so

days/weeks before regarding the long runtime of interface
checks on Juniper devices.

http://lists.mathias-kettner.de/pipermail/checkmk-en/2015-June/015902.html

          The result of this discussion was that Juniper has some

stupid SNMP implementation and it is nearly impossible to
monitor the complete switch if there are more than some
ports on the switch.

Best regards

Andreas

Matthew Nickerson <mnickers@cs.cmu.edu >
schrieb am Mo., 9. Nov. 2015 um 20:01 Uhr:

            Can someone also please explain

what the check called “check_mk”

            actually does.  I know this sounds so stupid, but I

can’t figure it

            out.  I assume it is a count of how long it takes to

complete all of the

            checks assigned to a given host, maybe? I do know this,

when interface

            monitoring is on, the execution time of this process is

increased on

            average by about 3.5 times on every device. Take a look

at the attached

            photo, of the check_mk execution time.  Ythe time when I

disabled

            interface monitoring.  Very significant difference. I'm

trying to figure

            out how these two things tie together to troubleshoot

this.

            Thanks in advance all!


            On 11/9/2015 1:28 PM, Matthew Nickerson wrote:

            > So, as Lance pointed out to me once, I know there

was a big discussion

            > that took place just before I joined the list. 

I’ve read through it,

            > but I'm wondering if there have been any

developments. This

            > conversation was in regard to SNMP checks,

timeouts, and CPU usage on

            > Juniper devices with Check_MK.

            >

            > As it stands, now, when I enable  interface

monitoring (evenly solely

            > on my critical links) the CPU usage goes through

the roof and timouts

            > and retries happen all over the place.  I have set

all of the timers

            > various SNMP checks super low, and have tweaked my

SNMP timout and

            > retry values, (currently at 7 seconds with 5 second

retry) but it

            > isn't helping much

            >

            > Let me also say that we are currently using Zenoss

AND Infoblox

            > NetMRI, both of which are monitoring these Juniper

Switches. Further,

            > when they are turned on they are monitoring EVERY

single interface on

            > every juniper switch at 10 minute intervals and 

they do not cause the

            > above mentioned problems on the switches.  I have

tried turning them

            > off, and in fact, have them turned off completely

on the problem

            > switches and still all of the issues appear when

check_mk is

            > monitoring even just a handful of interfaces... 

This leads me to

            > believe that, indeed there may be something wrong

with the juniper

            > checks.

            >

            > Just trying to get some input, because as it stands

I won’t be able to

            > use check_mk, unfortunately, because I absolutely

love it and want to

            > get rid everything else!

            >

            > Help!

            >


            --

            Matthew Nickerson

            Network Engineer

            Computing Facilities, SCS

            Carnegie Mellon University

            (412) 268-7273

            checkmk-en mailing list

            checkmk-en@lists.mathias-kettner.de

            [http://lists.mathias-kettner.de/mailman/listinfo/checkmk-en](http://lists.mathias-kettner.de/mailman/listinfo/checkmk-en)
      _______________________________________________

      checkmk-en mailing list

      checkmk-en@lists.mathias-kettner.de

      [http://lists.mathias-kettner.de/mailman/listinfo/checkmk-en](http://lists.mathias-kettner.de/mailman/listinfo/checkmk-en)
_______________________________________________
checkmk-en mailing list
checkmk-en@lists.mathias-kettner.de
[http://lists.mathias-kettner.de/mailman/listinfo/checkmk-en](http://lists.mathias-kettner.de/mailman/listinfo/checkmk-en)

checkmk-en mailing list

checkmk-en@lists.mathias-kettner.de

http://lists.mathias-kettner.de/mailman/listinfo/checkmk-en

That sounds cool, when would you expect that to be released for us free users?

Cheers

If it comes to classic interface checks take a look at check_nwc_health from Consol.
This is one of the best approaches to checking all the different types of network devices with only one classic check.

I use this for some remote devices on very limited bandwidth and it is working without problem, with check_mk interface checks there are too many timeouts over this wan connection. With the next innovation releases comes an option to only pull selected interfaces from a network device with check_mk. This will make then such constructs obsolete.

Best regards

Andreas

···

Jam Mulch spammagnet10@gmail.com schrieb am Di., 10. Nov. 2015 um 17:41 Uhr:

When it comes down to it, you should probably use the best tool for

the job.

I use Nagios XI for most of my external checks, and Check_MK for

most of

my internal checks, though I'm starting to switch to Check_MK for

some of

the storage (NetApp, Isilon, etc...) since it generates individual

services

and makes it easier to manage larger dynamic installations.

On 11/10/2015 03:09 AM, William wrote:

    Hi, we are still in a situation where we can't

monitor our ex2200s.

    Our other tech is trying to push zabbix because of

this issue which sucks as check_mk seems alot friendlier to
manage. :frowning:

    On 9 Nov 2015 19:41, "Andreas Döhler" > > <andreas.doehler@gmail.com        > > > wrote:

Hi Matthew,

          yes the "Check_MK" service is the only active service

pulling all the needed data from the target device. The
shown time is the complete runtime to pull the data.

          I can remember that there where a discussion so

days/weeks before regarding the long runtime of interface
checks on Juniper devices.

http://lists.mathias-kettner.de/pipermail/checkmk-en/2015-June/015902.html

          The result of this discussion was that Juniper has some

stupid SNMP implementation and it is nearly impossible to
monitor the complete switch if there are more than some
ports on the switch.

Best regards

Andreas

Matthew Nickerson <mnickers@cs.cmu.edu >
schrieb am Mo., 9. Nov. 2015 um 20:01 Uhr:

            Can someone also please explain

what the check called “check_mk”

            actually does.  I know this sounds so stupid, but I

can’t figure it

            out.  I assume it is a count of how long it takes to

complete all of the

            checks assigned to a given host, maybe? I do know this,

when interface

            monitoring is on, the execution time of this process is

increased on

            average by about 3.5 times on every device. Take a look

at the attached

            photo, of the check_mk execution time.  Ythe time when I

disabled

            interface monitoring.  Very significant difference. I'm

trying to figure

            out how these two things tie together to troubleshoot

this.

            Thanks in advance all!


            On 11/9/2015 1:28 PM, Matthew Nickerson wrote:

            > So, as Lance pointed out to me once, I know there

was a big discussion

            > that took place just before I joined the list. 

I’ve read through it,

            > but I'm wondering if there have been any

developments. This

            > conversation was in regard to SNMP checks,

timeouts, and CPU usage on

            > Juniper devices with Check_MK.

            >

            > As it stands, now, when I enable  interface

monitoring (evenly solely

            > on my critical links) the CPU usage goes through

the roof and timouts

            > and retries happen all over the place.  I have set

all of the timers

            > various SNMP checks super low, and have tweaked my

SNMP timout and

            > retry values, (currently at 7 seconds with 5 second

retry) but it

            > isn't helping much

            >

            > Let me also say that we are currently using Zenoss

AND Infoblox

            > NetMRI, both of which are monitoring these Juniper

Switches. Further,

            > when they are turned on they are monitoring EVERY

single interface on

            > every juniper switch at 10 minute intervals and 

they do not cause the

            > above mentioned problems on the switches.  I have

tried turning them

            > off, and in fact, have them turned off completely

on the problem

            > switches and still all of the issues appear when

check_mk is

            > monitoring even just a handful of interfaces... 

This leads me to

            > believe that, indeed there may be something wrong

with the juniper

            > checks.

            >

            > Just trying to get some input, because as it stands

I won’t be able to

            > use check_mk, unfortunately, because I absolutely

love it and want to

            > get rid everything else!

            >

            > Help!

            >


            --

            Matthew Nickerson

            Network Engineer

            Computing Facilities, SCS

            Carnegie Mellon University

            (412) 268-7273

            checkmk-en mailing list

            checkmk-en@lists.mathias-kettner.de

            [http://lists.mathias-kettner.de/mailman/listinfo/checkmk-en](http://lists.mathias-kettner.de/mailman/listinfo/checkmk-en)
      _______________________________________________

      checkmk-en mailing list

      checkmk-en@lists.mathias-kettner.de

      [http://lists.mathias-kettner.de/mailman/listinfo/checkmk-en](http://lists.mathias-kettner.de/mailman/listinfo/checkmk-en)
_______________________________________________
checkmk-en mailing list
checkmk-en@lists.mathias-kettner.de
[http://lists.mathias-kettner.de/mailman/listinfo/checkmk-en](http://lists.mathias-kettner.de/mailman/listinfo/checkmk-en)

checkmk-en mailing list

checkmk-en@lists.mathias-kettner.de

http://lists.mathias-kettner.de/mailman/listinfo/checkmk-en


checkmk-en mailing list

checkmk-en@lists.mathias-kettner.de

http://lists.mathias-kettner.de/mailman/listinfo/checkmk-en

It’s a Nagios plugin from a developer at Consol.de, not by Check_MK: https://github.com/lausser/check_nwc_health / https://labs.consol.de/nagios/check_nwc_health/index.html

…the latter is in German but I think you can translate it by the usual translators.

Regards,

Marcel

···

William willay@gmail.com schrieb am Di., 10. Nov. 2015 um 18:53 Uhr:

That sounds cool, when would you expect that to be released for us free users?

Cheers

If it comes to classic interface checks take a look at check_nwc_health from Consol.
This is one of the best approaches to checking all the different types of network devices with only one classic check.

I use this for some remote devices on very limited bandwidth and it is working without problem, with check_mk interface checks there are too many timeouts over this wan connection. With the next innovation releases comes an option to only pull selected interfaces from a network device with check_mk. This will make then such constructs obsolete.

Best regards

Andreas

Jam Mulch spammagnet10@gmail.com schrieb am Di., 10. Nov. 2015 um 17:41 Uhr:

When it comes down to it, you should probably use the best tool for

the job.

I use Nagios XI for most of my external checks, and Check_MK for

most of

my internal checks, though I'm starting to switch to Check_MK for

some of

the storage (NetApp, Isilon, etc...) since it generates individual

services

and makes it easier to manage larger dynamic installations.

On 11/10/2015 03:09 AM, William wrote:

    Hi, we are still in a situation where we can't

monitor our ex2200s.

    Our other tech is trying to push zabbix because of

this issue which sucks as check_mk seems alot friendlier to
manage. :frowning:

    On 9 Nov 2015 19:41, "Andreas Döhler" > > > <andreas.doehler@gmail.com        > > > > wrote:

Hi Matthew,

          yes the "Check_MK" service is the only active service

pulling all the needed data from the target device. The
shown time is the complete runtime to pull the data.

          I can remember that there where a discussion so

days/weeks before regarding the long runtime of interface
checks on Juniper devices.

http://lists.mathias-kettner.de/pipermail/checkmk-en/2015-June/015902.html

          The result of this discussion was that Juniper has some

stupid SNMP implementation and it is nearly impossible to
monitor the complete switch if there are more than some
ports on the switch.

Best regards

Andreas

Matthew Nickerson <mnickers@cs.cmu.edu >
schrieb am Mo., 9. Nov. 2015 um 20:01 Uhr:

            Can someone also please explain

what the check called “check_mk”

            actually does.  I know this sounds so stupid, but I

can’t figure it

            out.  I assume it is a count of how long it takes to

complete all of the

            checks assigned to a given host, maybe? I do know this,

when interface

            monitoring is on, the execution time of this process is

increased on

            average by about 3.5 times on every device. Take a look

at the attached

            photo, of the check_mk execution time.  Ythe time when I

disabled

            interface monitoring.  Very significant difference. I'm

trying to figure

            out how these two things tie together to troubleshoot

this.

            Thanks in advance all!


            On 11/9/2015 1:28 PM, Matthew Nickerson wrote:

            > So, as Lance pointed out to me once, I know there

was a big discussion

            > that took place just before I joined the list. 

I’ve read through it,

            > but I'm wondering if there have been any

developments. This

            > conversation was in regard to SNMP checks,

timeouts, and CPU usage on

            > Juniper devices with Check_MK.

            >

            > As it stands, now, when I enable  interface

monitoring (evenly solely

            > on my critical links) the CPU usage goes through

the roof and timouts

            > and retries happen all over the place.  I have set

all of the timers

            > various SNMP checks super low, and have tweaked my

SNMP timout and

            > retry values, (currently at 7 seconds with 5 second

retry) but it

            > isn't helping much

            >

            > Let me also say that we are currently using Zenoss

AND Infoblox

            > NetMRI, both of which are monitoring these Juniper

Switches. Further,

            > when they are turned on they are monitoring EVERY

single interface on

            > every juniper switch at 10 minute intervals and 

they do not cause the

            > above mentioned problems on the switches.  I have

tried turning them

            > off, and in fact, have them turned off completely

on the problem

            > switches and still all of the issues appear when

check_mk is

            > monitoring even just a handful of interfaces... 

This leads me to

            > believe that, indeed there may be something wrong

with the juniper

            > checks.

            >

            > Just trying to get some input, because as it stands

I won’t be able to

            > use check_mk, unfortunately, because I absolutely

love it and want to

            > get rid everything else!

            >

            > Help!

            >


            --

            Matthew Nickerson

            Network Engineer

            Computing Facilities, SCS

            Carnegie Mellon University

            (412) 268-7273

            checkmk-en mailing list

            checkmk-en@lists.mathias-kettner.de

            [http://lists.mathias-kettner.de/mailman/listinfo/checkmk-en](http://lists.mathias-kettner.de/mailman/listinfo/checkmk-en)
      _______________________________________________

      checkmk-en mailing list

      checkmk-en@lists.mathias-kettner.de

      [http://lists.mathias-kettner.de/mailman/listinfo/checkmk-en](http://lists.mathias-kettner.de/mailman/listinfo/checkmk-en)
_______________________________________________
checkmk-en mailing list
checkmk-en@lists.mathias-kettner.de
[http://lists.mathias-kettner.de/mailman/listinfo/checkmk-en](http://lists.mathias-kettner.de/mailman/listinfo/checkmk-en)

checkmk-en mailing list

checkmk-en@lists.mathias-kettner.de

http://lists.mathias-kettner.de/mailman/listinfo/checkmk-en


checkmk-en mailing list

checkmk-en@lists.mathias-kettner.de

http://lists.mathias-kettner.de/mailman/listinfo/checkmk-en


checkmk-en mailing list

checkmk-en@lists.mathias-kettner.de

http://lists.mathias-kettner.de/mailman/listinfo/checkmk-en

As far as only monitoring select interfaces this is the method I use
and it works great. This is a line in my main.mk file:

ignored_services = [([], ALL_HOSTS, ['(?i)(Interface

(?!(member|agg|trunk|uplink)))']),]

Basically this says, ignore all services that start with "Interface"

except those that start with Interface followed by “agg” or “trunk”
or “uplink”] (case insensitive). So on my switches I added or made
sure to have either AGG/TRUNK/UPLINK come first, whichever was most
applicable.

So as I said, I'm only monitoring a handful of interfaces on each

switch, but even monitoring three causes issues.

This is the thing:  why doesn't Zenoss or NetMRI cause the same

issues, these are monitoring EVERY port on the switch. Is there a
way to look at the check itself? I had trouble finding it’s
location and sort of gave up. I would like to compare the Zenoss
Code to the MK/nagios code and see if I can discern anything.

I also appreciate the other suggestions everyone has provided.  And

I do agree, use the tool that works best, BUT having just one tool
would be so nice! :slight_smile:

Matt
···

On 11/10/2015 12:51 PM, William wrote:

    That sounds cool, when would you expect that to be

released for us free users?

Cheers

      If it comes to classic interface checks take a

look at check_nwc_health from Consol.
This is one of the best approaches to checking all the
different types of network devices with only one classic
check.

        I use this for some remote devices on very limited

bandwidth and it is working without problem, with check_mk
interface checks there are too many timeouts over this wan
connection. With the next innovation releases comes an
option to only pull selected interfaces from a network
device with check_mk. This will make then such constructs
obsolete.

Best regards

Andreas

Jam Mulch <spammagnet10@gmail.com >
schrieb am Di., 10. Nov. 2015 um 17:41 Uhr:

              When it comes

down to it, you should probably use the best tool for
the job.

              I use Nagios XI for most of my external checks, and

Check_MK for most of

              my internal checks, though I'm starting to switch to

Check_MK for some of

              the storage (NetApp, Isilon, etc...) since it

generates individual services

              and makes it easier to manage larger dynamic

installations.

On 11/10/2015 03:09 AM, William wrote:

                  Hi, we are still in a situation where

we can’t monitor our ex2200s.

                  Our other tech is trying to push zabbix

because of this issue which sucks as check_mk
seems alot friendlier to manage. :frowning:

                  On 9 Nov 2015 19:41,

“Andreas Döhler” <andreas.doehler@gmail.com
>
wrote:

Hi Matthew,

                        yes the "Check_MK" service is the only

active service pulling all the needed data
from the target device. The shown time is
the complete runtime to pull the data.

                        I can remember that there where a

discussion so days/weeks before regarding
the long runtime of interface checks on
Juniper devices.

http://lists.mathias-kettner.de/pipermail/checkmk-en/2015-June/015902.html

                        The result of this discussion was that

Juniper has some stupid SNMP implementation
and it is nearly impossible to monitor the
complete switch if there are more than some
ports on the switch.

Best regards

Andreas

Matthew Nickerson <
>
schrieb am Mo., 9. Nov. 2015 um 20:01 Uhr:

                          Can someone also please explain what

the check called “check_mk”

                          actually does.  I know this sounds so

stupid, but I can’t figure it

                          out.  I assume it is a count of how long

it takes to complete all of the

                          checks assigned to a given host, maybe? I

do know this, when interface

                          monitoring is on, the execution time of

this process is increased on

                          average by about 3.5 times on every

device. Take a look at the attached

                          photo, of the check_mk execution time. 

Ythe time when I disabled

                          interface monitoring.  Very significant

difference. I’m trying to figure

                          out how these two things tie together to

troubleshoot this.

                          Thanks in advance all!


                          On 11/9/2015 1:28 PM, Matthew Nickerson

wrote:

                          > So, as Lance pointed out to me once,

I know there was a big discussion

                          > that took place just before I joined

the list. I’ve read through it,

                          > but I'm wondering if there have been

any developments. This

                          > conversation was in regard to SNMP

checks, timeouts, and CPU usage on

                          > Juniper devices with Check_MK.

                          >

                          > As it stands, now, when I enable 

interface monitoring (evenly solely

                          > on my critical links) the CPU usage

goes through the roof and timouts

                          > and retries happen all over the

place. I have set all of the timers

                          > various SNMP checks super low, and

have tweaked my SNMP timout and

                          > retry values, (currently at 7 seconds

with 5 second retry) but it

                          > isn't helping much

                          >

                          > Let me also say that we are currently

using Zenoss AND Infoblox

                          > NetMRI, both of which are monitoring

these Juniper Switches. Further,

                          > when they are turned on they are

monitoring EVERY single interface on

                          > every juniper switch at 10 minute

intervals and they do not cause the

                          > above mentioned problems on the

switches. I have tried turning them

                          > off, and in fact, have them turned

off completely on the problem

                          > switches and still all of the issues

appear when check_mk is

                          > monitoring even just a handful of

interfaces… This leads me to

                          > believe that, indeed there may be

something wrong with the juniper

                          > checks.

                          >

                          > Just trying to get some input,

because as it stands I won’t be able to

                          > use check_mk, unfortunately, because

I absolutely love it and want to

                          > get rid everything else!

                          >

                          > Help!

                          >


                          --

                          Matthew Nickerson

                          Network Engineer

                          Computing Facilities, SCS

                          Carnegie Mellon University

                          (412) 268-7273

                          checkmk-en mailing list

                          checkmk-en@lists.mathias-kettner.de

                          [http://lists.mathias-kettner.de/mailman/listinfo/checkmk-en](http://lists.mathias-kettner.de/mailman/listinfo/checkmk-en)
                    _______________________________________________

                    checkmk-en mailing list

                    checkmk-en@lists.mathias-kettner.de

                    [http://lists.mathias-kettner.de/mailman/listinfo/checkmk-en](http://lists.mathias-kettner.de/mailman/listinfo/checkmk-en)
_______________________________________________
checkmk-en mailing list
checkmk-en@lists.mathias-kettner.de
[http://lists.mathias-kettner.de/mailman/listinfo/checkmk-en](http://lists.mathias-kettner.de/mailman/listinfo/checkmk-en)

            checkmk-en mailing list

            checkmk-en@lists.mathias-kettner.de

            [http://lists.mathias-kettner.de/mailman/listinfo/checkmk-en](http://lists.mathias-kettner.de/mailman/listinfo/checkmk-en)
    _______________________________________________

    checkmk-en mailing list

    checkmk-en@lists.mathias-kettner.de

    [http://lists.mathias-kettner.de/mailman/listinfo/checkmk-en](http://lists.mathias-kettner.de/mailman/listinfo/checkmk-en)
-- Matthew Nickerson
Network Engineer
Computing Facilities, SCS
Carnegie Mellon University
(412) 268-7273

mnickers@cs.cmu.edu

I’m woefully ignorant about SNMP, but here’s what I found from
Google.
It seems Juniper wants their devices to be polled ‘row by row’
instead of ‘column by column’ which
from what I’ve read, excludes using NetSNMP snmpwalk/bulkwalk.

From:�
···

http://www.juniper.net/documentation/en_US/junos14.1/topics/reference/general/snmp-junos-faq.html

SNMP Interaction with

Juniper Networks Devices FAQs
This section presents frequently asked questions
and answers
related to how SNMP interacts with Juniper Networks devices.

** How frequently should a device be polled? What
is a good polling rate?**

    It is difficult to give an absolute number for

the rate of SNMP
polls per second since the rate depends on the following two
factors:

  •     The number of variable bindings in a protocol data
    

    unit
    (PDU)

  •     The response time for an interface from the Packet
    

    Forwarding
    Engine
    In a normal scenario where no delay is being
    introduced by the
    Packet Forwarding Engine and there is one variable per PDU (a Get
    request), the response time is 130+ responses per second. However,
    with multiple variables in an SNMP request PDU (30 to 40 for
    GetBulk
    requests), the number of responses per second is much less.
    Because
    the Packet Forwarding Engine load can vary for each system, there
    is greater variation in how frequently a device should be polled.

      Frequent polling of a large number of counters,
    

especially statistics,
can impact the device. We recommend the following optimization
on
the SNMP managers:

  •     Use the row-by-row polling method, not the
    

    column-by-column
    method.

  • Reduce the number of variable bindings per PDU.

  •     Increase timeout values in polling and discovery
    

    intervals.

  •     Reduce the incoming packet rate at the SNMP process
    

    (snmpd).
    For better SNMP response on the device, the Junos
    OS does the
    following:

  • Filters out duplicate SNMP requests.

  •     Excludes interfaces that are slow in response from
    

    SNMP
    queries.
    One way to determine a rate limit is to note an
    increase in
    the Currently Active count
    from the show snmp statistics
    extensive command.

The following is a sample output of the show snmp statistics
extensive command:

user@host> ** show snmp statistics extensive**

   SNMP statistics:
Input:
Packets: 226656, Bad versions: 0, Bad community names: 0,
Bad community uses: 0, ASN parse errors: 0,
Too bigs: 0, No such names: 0, Bad values: 0,
Read onlys: 0, General errors: 0,
Total request varbinds: 1967606, Total set varbinds: 0,
Get requests: 18478, Get nexts: 75794, Set requests: 0,
Get responses: 0, Traps: 0,
Silent drops: 0, Proxy drops: 0, Commit pending drops: 0,
Throttle drops: 27084, Duplicate request drops: 0
V3 Input:
Unknown security models: 0, Invalid messages: 0
Unknown pdu handlers: 0, Unavailable contexts: 0
Unknown contexts: 0, Unsupported security levels: 0
Not in time windows: 0, Unknown user names: 0
Unknown engine ids: 0, Wrong digests: 0, Decryption errors: 0
Output:
Packets: 226537, Too bigs: 0, No such names: 0,
Bad values: 0, General errors: 0,
Get requests: 0, Get nexts: 0, Set requests: 0,
Get responses: 226155, Traps: 382
SA Control Blocks:
Total: 222984, **Currently Active: 501**     , Max Active: 501,
Not found: 0, Timed Out: 0, Max Latency: 25
SA Registration:
Registers: 0, Deregisters: 0, Removes: 0
Trap Queue Stats:
Current queued: 0, Total queued: 0, Discards: 0, Overflows: 0
Trap Throttle Stats:
Current throttled: 0, Throttles needed: 0
Snmp Set Stats:
Commit pending failures: 0, Config lock failures: 0
Rpc failures: 0, Journal write failures: 0
Mgd connect failures: 0, General commit failures: 0

On 11/10/2015 03:09 AM, William wrote:

    Hi, we are still in a situation where we can't

monitor our ex2200s.

    Our other tech is trying to push zabbix because of

this issue which sucks as check_mk seems alot friendlier to
manage. :frowning:

    On 9 Nov 2015 19:41, "Andreas D�hler"

<andreas.doehler@gmail.com >
wrote:

Hi Matthew,

          yes the "Check_MK" service is the only active service

pulling all the needed data from the target device. The
shown time is the complete runtime to pull the data.

          I can remember that there where a discussion so

days/weeks before regarding the long runtime of interface
checks on Juniper devices.

http://lists.mathias-kettner.de/pipermail/checkmk-en/2015-June/015902.html

          The result of this discussion was that Juniper has some

stupid SNMP implementation and it is nearly impossible to
monitor the complete switch if there are more than some
ports on the switch.

Best regards

Andreas

Matthew Nickerson < >
schrieb am Mo., 9. Nov. 2015 um 20:01�Uhr:

            Can someone also please explain

what the check called “check_mk”

            actually does.� I know this sounds so stupid, but I

can’t figure it

            out.� I assume it is a count of how long it takes to

complete all of the

            checks assigned to a given host, maybe? I do know this,

when interface

            monitoring is on, the execution time of this process is

increased on

            average by about 3.5 times on every device. Take a look

at the attached

            photo, of the check_mk execution time.� Ythe time when I

disabled

            interface monitoring.� Very significant difference. I'm

trying to figure

            out how these two things tie together to troubleshoot

this.

            Thanks in advance all!


            On 11/9/2015 1:28 PM, Matthew Nickerson wrote:

            > So, as Lance pointed out to me once, I know there

was a big discussion

            > that took place just before I joined the list.�

I’ve read through it,

            > but I'm wondering if there have been any

developments. This

            > conversation was in regard to SNMP checks,

timeouts, and CPU usage on

            > Juniper devices with Check_MK.

            >

            > As it stands, now, when I enable� interface

monitoring (evenly solely

            > on my critical links) the CPU usage goes through

the roof and timouts

            > and retries happen all over the place.� I have set

all of the timers

            > various SNMP checks super low, and have tweaked my

SNMP timout and

            > retry values, (currently at 7 seconds with 5 second

retry) but it

            > isn't helping much

            >

            > Let me also say that we are currently using Zenoss

AND Infoblox

            > NetMRI, both of which are monitoring these Juniper

Switches. Further,

            > when they are turned on they are monitoring EVERY

single interface on

            > every juniper switch at 10 minute intervals and�

they do not cause the

            > above mentioned problems on the switches.� I have

tried turning them

            > off, and in fact, have them turned off completely

on the problem

            > switches and still all of the issues appear when

check_mk is

            > monitoring even just a handful of interfaces...�

This leads me to

            > believe that, indeed there may be something wrong

with the juniper

            > checks.

            >

            > Just trying to get some input, because as it stands

I won’t be able to

            > use check_mk, unfortunately, because I absolutely

love it and want to

            > get rid everything else!

            >

            > Help!

            >


            --

            Matthew Nickerson

            Network Engineer

            Computing Facilities, SCS

            Carnegie Mellon University

            (412) 268-7273

            checkmk-en mailing list

            checkmk-en@lists.mathias-kettner.de

            [http://lists.mathias-kettner.de/mailman/listinfo/checkmk-en](http://lists.mathias-kettner.de/mailman/listinfo/checkmk-en)
      _______________________________________________

      checkmk-en mailing list

      checkmk-en@lists.mathias-kettner.de

      [http://lists.mathias-kettner.de/mailman/listinfo/checkmk-en](http://lists.mathias-kettner.de/mailman/listinfo/checkmk-en)
_______________________________________________
checkmk-en mailing list

mnickers@cs.cmu.edu
checkmk-en@lists.mathias-kettner.dehttp://lists.mathias-kettner.de/mailman/listinfo/checkmk-en

Welcome to the great land of the snmp on cheap juniper network device. And be sorry. The paper of juniper is right.

Basicaly the snmp implementation of snmp in juniper is completly crappy as polling the device can completly kill the cpu, and so every userland daemons of the swith/routeur (rpd, lacpd, etc...) can suffer and have no time left to run, results in variety of bad things (lost of lacp link, routing protocol hang, etc...) Note: forwarding, routing is not affected.

This is completly stupid that snmp can kill vitals functions of a network device... but it was the case :confused: and juniper have no real plan to change this...

That says, this is not completly impossible to safely monitor this type of device using snmp (I suppose we talk about EX2200, 3300, 45XX, with cheap cpu, high end router do not pose problem).

You must avoid using snmpwalk on this device, specialy on IF part of the mib. That's why monitoring tools are not equal monitoring this type of devices :

- obversium is the worst, as it try to snmpwalk at each run almost the entire IF mib (and a lot of other). The result can be catastrophic.
Anyway the observium poller is just a joke.

- check mk (with basic interface) check do the same, but poll less part of the mib (but this can cause problem also). Afaik check_mk compile all snmp requests on one device and do walk on it.

- cacti is the right way to do : first poll to detect/scan wich interface are present (poller cache), and then at each run do small targetet snmpget.

So this is the way to do :
- implement a cache of oid to get (refresh it manualy)
- do targeted small snmp get, and better space it out.

I don't know if check_mk can be optimized (or de optimized) for handling such bad network devices.

Regards,

Le 10/11/15 21:46, Jam Mulch a �crit :

···

I'm woefully ignorant about SNMP, but here's what I found from Google.
It seems Juniper wants their devices to be polled 'row by row' instead
of 'column by column' which
from what I've read, excludes using NetSNMP snmpwalk/bulkwalk.

From:
Network Monitoring by using SNMP | Junos OS | Juniper Networks

--
Raphael Mazelier
AS39605

Thank you to everyone who contributed to this. It is helpful.

...

That says, this is not completly impossible to safely monitor this type
of device using snmp (I suppose we talk about EX2200, 3300, 45XX, with
cheap cpu, high end router do not pose problem).

Actually, my biggest "problem switch" is an EX8216! That said, it has a very high port density.

- cacti is the right way to do : first poll to detect/scan wich
interface are present (poller cache), and then at each run do small

We actually cacti have a cacti server ready to use here. And perhaps I could use the 'thold' plugin to generate syslog message, sending them to the check_mk event console. This might be the way to go.

Again, this list is a great resource thanks all!

Matt

···

On 11/10/2015 4:28 PM, Raphael Mazelier wrote:

--
Matthew Nickerson
Network Engineer
Computing Facilities, SCS
Carnegie Mellon University
(412) 268-7273

Hi Matt,

You can use "filter-interfaces"
(https://www.juniper.net/documentation/en_US/junos13.3/topics/reference/conf
iguration-statement/filter-interfaces-edit-snmp.html ), if it is possible,
and a decent (like 5 min) check interval.

Silviu Mocanu

···

-----Original Message-----
From: checkmk-en-bounces@lists.mathias-kettner.de
[mailto:checkmk-en-bounces@lists.mathias-kettner.de] On Behalf Of Matthew
Nickerson
Sent: Wednesday, November 11, 2015 4:58 PM
To: checkmk-en@lists.mathias-kettner.de
Subject: Re: [Check_mk (english)] Check_MK, SNMP, Juniper, Help!

Thank you to everyone who contributed to this. It is helpful.

On 11/10/2015 4:28 PM, Raphael Mazelier wrote:

...

That says, this is not completly impossible to safely monitor this
type of device using snmp (I suppose we talk about EX2200, 3300, 45XX,
with cheap cpu, high end router do not pose problem).

Actually, my biggest "problem switch" is an EX8216! That said, it has a
very high port density.

- cacti is the right way to do : first poll to detect/scan wich
interface are present (poller cache), and then at each run do small

We actually cacti have a cacti server ready to use here. And perhaps I
could use the 'thold' plugin to generate syslog message, sending them to the
check_mk event console. This might be the way to go.

Again, this list is a great resource thanks all!

Matt

--
Matthew Nickerson
Network Engineer
Computing Facilities, SCS
Carnegie Mellon University
(412) 268-7273

_______________________________________________
checkmk-en mailing list
checkmk-en@lists.mathias-kettner.de
http://lists.mathias-kettner.de/mailman/listinfo/checkmk-en

________________________________

This e-mail and any attachment(s) are intended only for the recipient(s)
named above and others who have been specifically authorized to receive
them. They may contain confidential information. If you are not the intended
recipient, please do not read this email or its attachment(s). Furthermore,
you are hereby notified that any dissemination, distribution or copying of
this e-mail and any attachment(s) is strictly prohibited. If you have
received this e-mail in error, please immediately notify the sender by
replying to this e-mail and then delete this e-mail and any attachment(s) or
copies thereof from your system. Thank you.

This e-mail and any attachment(s) are intended only for the recipient(s) named above and
others who have been specifically authorized to receive them. They may contain confidential
information. If you are not the intended recipient, please do not read this email or its
attachment(s). Furthermore, you are hereby notified that any dissemination, distribution or
copying of this e-mail and any attachment(s) is strictly prohibited. If you have received this
e-mail in error, please immediately notify the sender by replying to this e-mail and then
delete this e-mail and any attachment(s) or copies thereof from your system. Thank you.

Le 11/11/15 15:57, Matthew Nickerson a �crit :

Actually, my biggest "problem switch" is an EX8216! That said, it has a
very high port density.

Ah EX8XXX: very good switch chassis; unfortunelaty juniper have made the choice to put small pcc processors on REs.
And with the number of ports, walking the mib can be endless.
I have couple of EX3300 Virtual chassis with eitgh members who suffers the same problems.

We actually cacti have a cacti server ready to use here. And perhaps I
could use the 'thold' plugin to generate syslog message, sending them to
the check_mk event console. This might be the way to go.

I didn't say that using cacti is the right solution (well it's what I use for graphing my devices). I say that the way that cacti poll device is the only good way for polling juniper device like theses.

You can use specific nagios probes also (I you want I can share mine).

Another tips are:

- polling frequencies : 5min should be OK in most case
- snmp can be tweaked a bit on juniper side, (filer interface, filter duplicate, etc...)

Regards,

···

--
Raphael Mazelier

Would any of these snmp options help? Maybe limit SNMP OID ranges or Legacy devices?

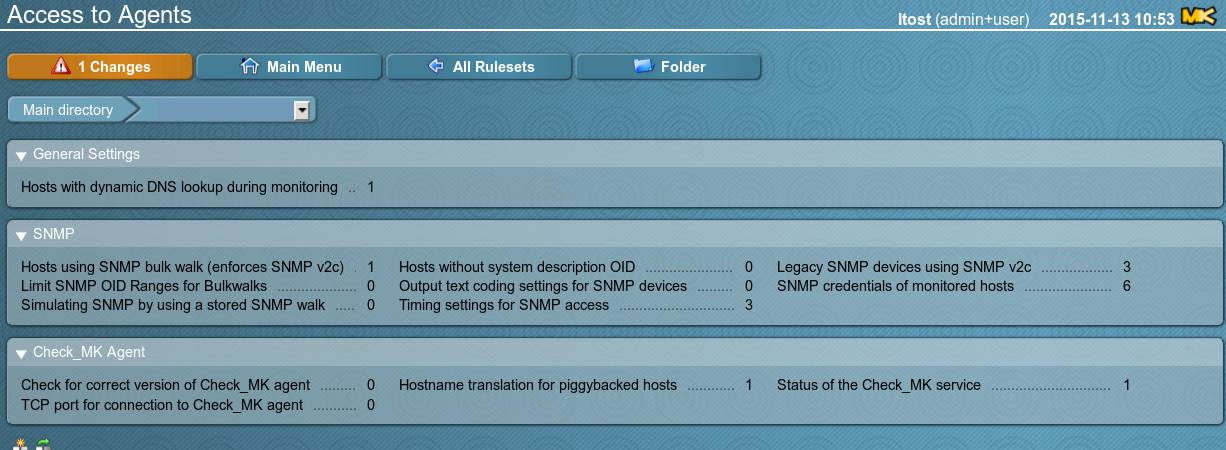
Legacy devices using v2c help says this: There exist a few devices out there that behave very badly when using SNMP v2c and bulk walk. If you want to use SNMP v2c on those devices, nevertheless, you need to configure this device as legacy snmp device and upgrade it to SNMP v2c (without bulk walk) with this rule set. One reason is enabling 64 bit counters. Note: This rule won't apply if the device is already configured as SNMP v2c device.

Thank you,
Lance Tost
lance.tost@key-stone.com
Sr. Network Administrator
Keystone Automotive Operations, Inc.

···

________________________________________
From: checkmk-en-bounces@lists.mathias-kettner.de <checkmk-en-bounces@lists.mathias-kettner.de> on behalf of Raphael Mazelier <raph@futomaki.net>
Sent: Tuesday, November 10, 2015 4:28 PM
To: checkmk-en@lists.mathias-kettner.de
Subject: Re: [Check_mk (english)] Check_MK, SNMP, Juniper, Help!

Welcome to the great land of the snmp on cheap juniper network device.
And be sorry. The paper of juniper is right.

Basicaly the snmp implementation of snmp in juniper is completly crappy
as polling the device can completly kill the cpu, and so every userland
daemons of the swith/routeur (rpd, lacpd, etc...) can suffer and have no
time left to run, results in variety of bad things (lost of lacp link,
routing protocol hang, etc...) Note: forwarding, routing is not affected.

This is completly stupid that snmp can kill vitals functions of a
network device... but it was the case :confused: and juniper have no real plan
to change this...

That says, this is not completly impossible to safely monitor this type
of device using snmp (I suppose we talk about EX2200, 3300, 45XX, with
cheap cpu, high end router do not pose problem).

You must avoid using snmpwalk on this device, specialy on IF part of the
mib. That's why monitoring tools are not equal monitoring this type of
devices :

- obversium is the worst, as it try to snmpwalk at each run almost the
entire IF mib (and a lot of other). The result can be catastrophic.
Anyway the observium poller is just a joke.

- check mk (with basic interface) check do the same, but poll less part
of the mib (but this can cause problem also). Afaik check_mk compile all
snmp requests on one device and do walk on it.

- cacti is the right way to do : first poll to detect/scan wich
interface are present (poller cache), and then at each run do small
targetet snmpget.

So this is the way to do :
- implement a cache of oid to get (refresh it manualy)
- do targeted small snmp get, and better space it out.

I don't know if check_mk can be optimized (or de optimized) for handling
such bad network devices.

Regards,

Le 10/11/15 21:46, Jam Mulch a écrit :

I'm woefully ignorant about SNMP, but here's what I found from Google.
It seems Juniper wants their devices to be polled 'row by row' instead
of 'column by column' which
from what I've read, excludes using NetSNMP snmpwalk/bulkwalk.

From:
Network Monitoring by using SNMP | Junos OS | Juniper Networks

--
Raphael Mazelier
AS39605
_______________________________________________
checkmk-en mailing list
checkmk-en@lists.mathias-kettner.de
https://urldefense.proofpoint.com/v2/url?u=http-3A__lists.mathias-2Dkettner.de_mailman_listinfo_checkmk-2Den&d=CwIF-g&c=rxuyg758I4Zd3CDHNny_Hw&r=IG1JnIFZjjAeb-dpz2SPNF_6BaSzaPzu56FYglLqpI0&m=tlX6FiGKFE1ETOMJL0CeCnvQv6WKf6aLunwxySW39y0&s=y-lR9JCzR7Y5eaIbY4uWj6_SHZRuAWYOu_h41UZ8Uqo&e=