Colored problems in Dashboard

Hi all,

I am searching an option within checkmk v2 to colorize the output of “Hosts - number of problems” within the dashboards.

I am migrated from checkmk v 1.5.0 to 2.1.0p17

In 1.4 there was the column colorized when a problem appeard.

Is there a way to get it back?

Hi & welcome

do you mean this
image

Unbenannt

This as example.
I want to achive somekind of coloration of the problem like in 1.6

1 Like

@mbrogies you might want to give just a little more context in your screenshot. At least I do not see at first glance, where you are there.

1 Like

Sure absoluteley no problem.

We had implemented a dashboard in the past for our OfficeTV to have an overview of all servers at a glace.
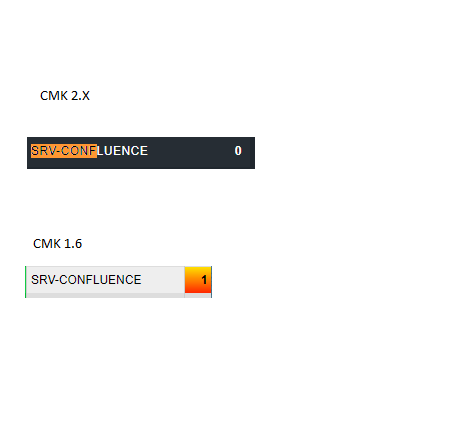
With our old version CMK Raw 1.6, we used the column “Hosts: Number of Problems”. With that, if a problem count was bigger then zero, it had changed the color of the Box to orange, to visualize that there is a problem.

With CMK 2.0 unfortunatly this function has gone.

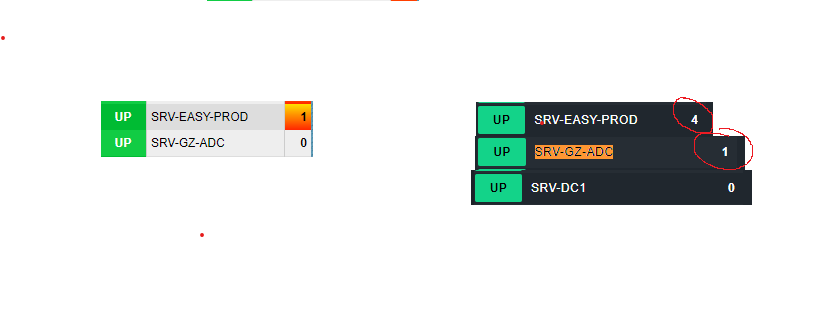
As an example, another screenshot:
Here you see exactly the problem / feature I have.
In 1.6, if a problem occures, the count will be visualized with a different color.
In 2.0 there happens nothing

I can confirm this … it would also be good if the column would be colored according to the severity of the error warn/crit

but you have similar functions with the columns:

hosts: hostname
hosts: number of services in state xxx

Greetz Bernd

Hi Bernd,

Thanks for the reply. I have saw that also already.

Unfortunatley, with arround 200 servers displayed, an aggregation of the different states in one row would be much easier to handle.

That’s why I am asking

Hi there!

Did you ever find a solution to this? I am looking to achieve the exact same thing.