This plugin provides individual metrics for each database.
I would like to create a consolidated view that combines these metrics on a graph. However, it appears that in checkmk, the database names need to be hardcoded in order to combine metrics on a graph. This approach is not suitable for me because I intend to run this plugin on instances that frequently change.
Could this be something checkmk can add to future releases?
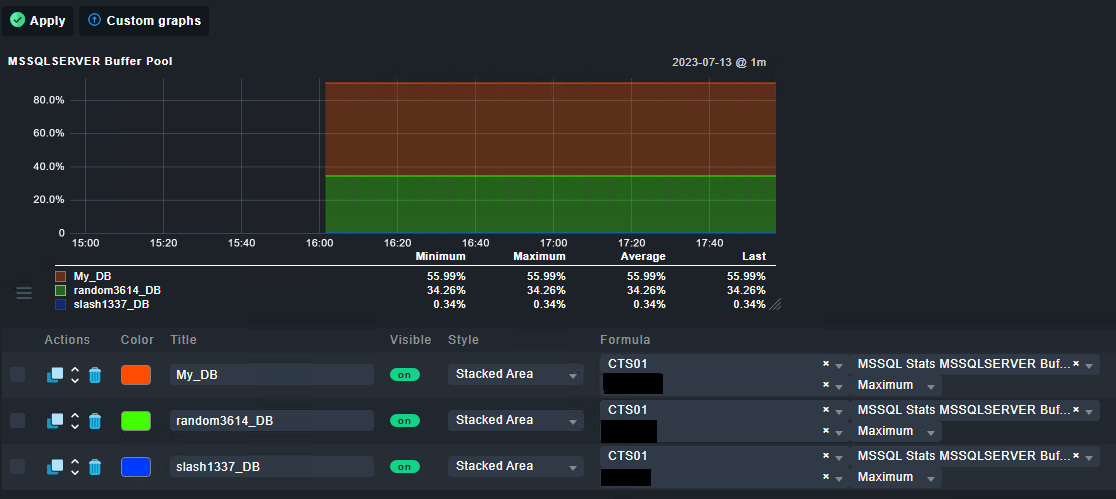
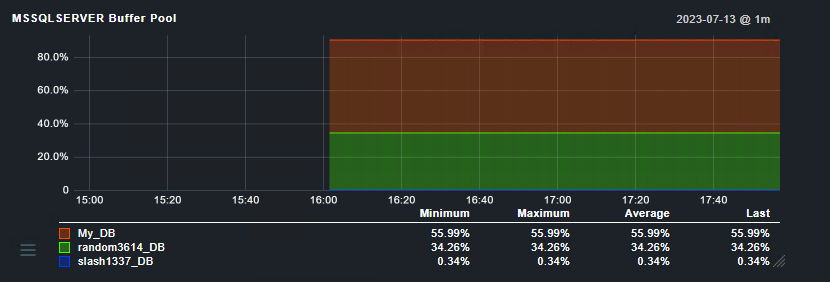
I manually created this custom graph by summing up the metrics of the databases, but this approach becomes impractical when the instance has over 100 databases and new ones can be added at any moment.
Is there any way to programmatically generate a custom graph like this?
thank you for the reply, i tried that and it seems to comebine services that yield a metric with a matching name. but i want to combine metrics by service
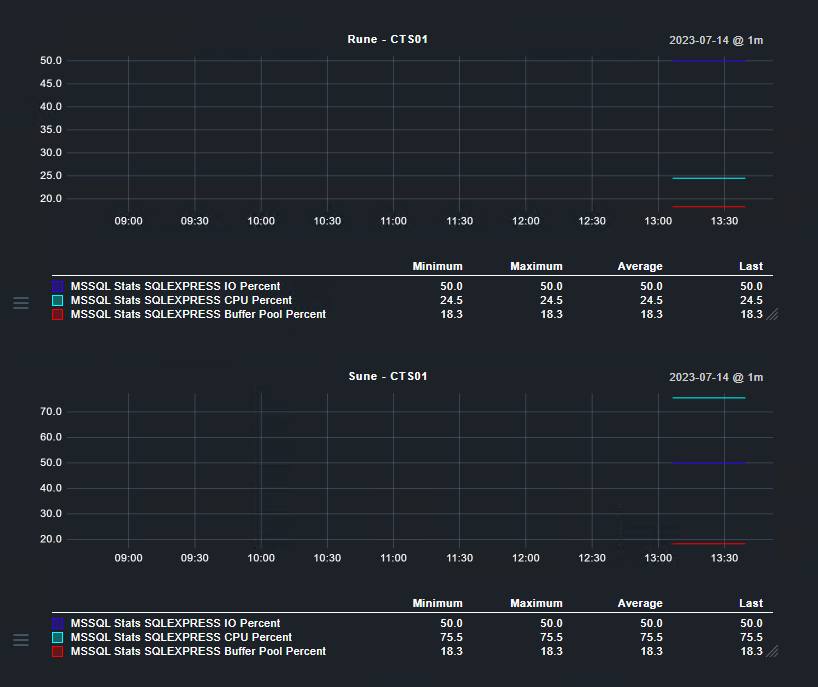
Service with name “metric DB_A” and the metric is called “db_a_io_percent”
Service with name “metric DB_B” and the metric is called “db_b_io_percent”
is that correct?
Or are db_b_io_percent and db_a_io_percent both metrics of the same service?
if you have multiple services: use the same logic that checkmk uses for all their plugins:
metrics don’t include the item (i.e. filesystem, db, interface) name - hence allowing the grouping
if you want all your metrics for different databases to be in the same service, I think you’ll need to dive into the metric definitions to see if you can group metrics with wildcards. It might be possible, but I guess it’s more complicated. Also, I think you’re possibly creating huge rrd files if you have a single service potentially collecting metrics for tens of databases. So I’d suggest: make you check split the results for each Database into a separate check item.