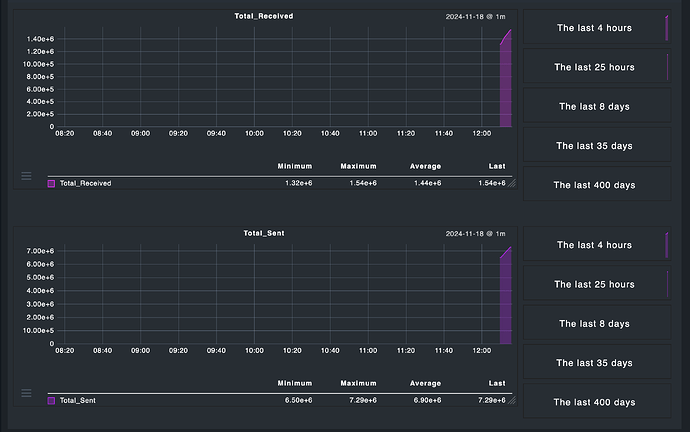
Using checkmk 2.2.0. I am writing a custom plugin, and want to achieve a combined graph instead of single graphs. I am reading these docs.
My setup on the agent:
 /usr/lib/check_mk_agent/plugins/my_agent_plugin.sh
<<<network_usage_monitor>>>
total_sent 6196601
total_received 1288127
The checkmk server, file: local/lib/check_mk/base/plugins/agent_based/my_network_1.py
#!/usr/bin/env python3

from .agent_based_api.v1 import (
    register,
    Result,
    Service,
    State,
    Metric,
)

# Parse the raw agent data
def parse_network_usage_monitor(string_table):
    parsed = {row[0]: int(row[1]) for row in string_table}
    return parsed

# Discover services for network usage
def discover_network_usage_monitor(section):
    yield Service()

# Check function for network usage
def check_network_usage_monitor(section):
    total_sent = section.get("total_sent", 0)
    total_received = section.get("total_received", 0)

    if total_sent is not None and total_received is not None:
        yield Result(
            state=State.OK,
            summary=f"Sent: {total_sent} bytes, Received: {total_received} bytes",
        )
        # Add performance metrics
        yield Metric("total_sent", total_sent)
        yield Metric("total_received", total_received)
    else:
        yield Result(
            state=State.CRIT,
            summary="Network metrics are missing or incomplete.",
        )

# Register the plugin
register.agent_section(
    name="network_usage_monitor",
    parse_function=parse_network_usage_monitor,
)

register.check_plugin(
    name="network_usage_monitor",
    service_name="Network Usage",
    discovery_function=discover_network_usage_monitor,
    check_function=check_network_usage_monitor,
)
The visualization metric graph, at: local/share/check_mk/web/plugins/metrics/metrics.py
from cmk.gui.plugins.metrics import metric_info, graph_info
from cmk.gui.i18n import _

# Define metrics
metric_info["total_sent"] = {
    "title": _("Total Bytes Sent"),
    "unit": "bytes",
    "color": "33/a",
}

metric_info["total_received"] = {
    "title": _("Total Bytes Received"),
    "unit": "bytes",
    "color": "11/a",
}

# Define a single combined graph for network usage
graph_info["network_usage"] = {
    "title": _("Network Usage Overview"),
    "metrics": [
        ("total_received", "area"),  # Received as an area graph
        ("total_sent", "line"),      # Sent as a line graph
    ],
}
The metrics do show up in checkmk, but not the combined one.
