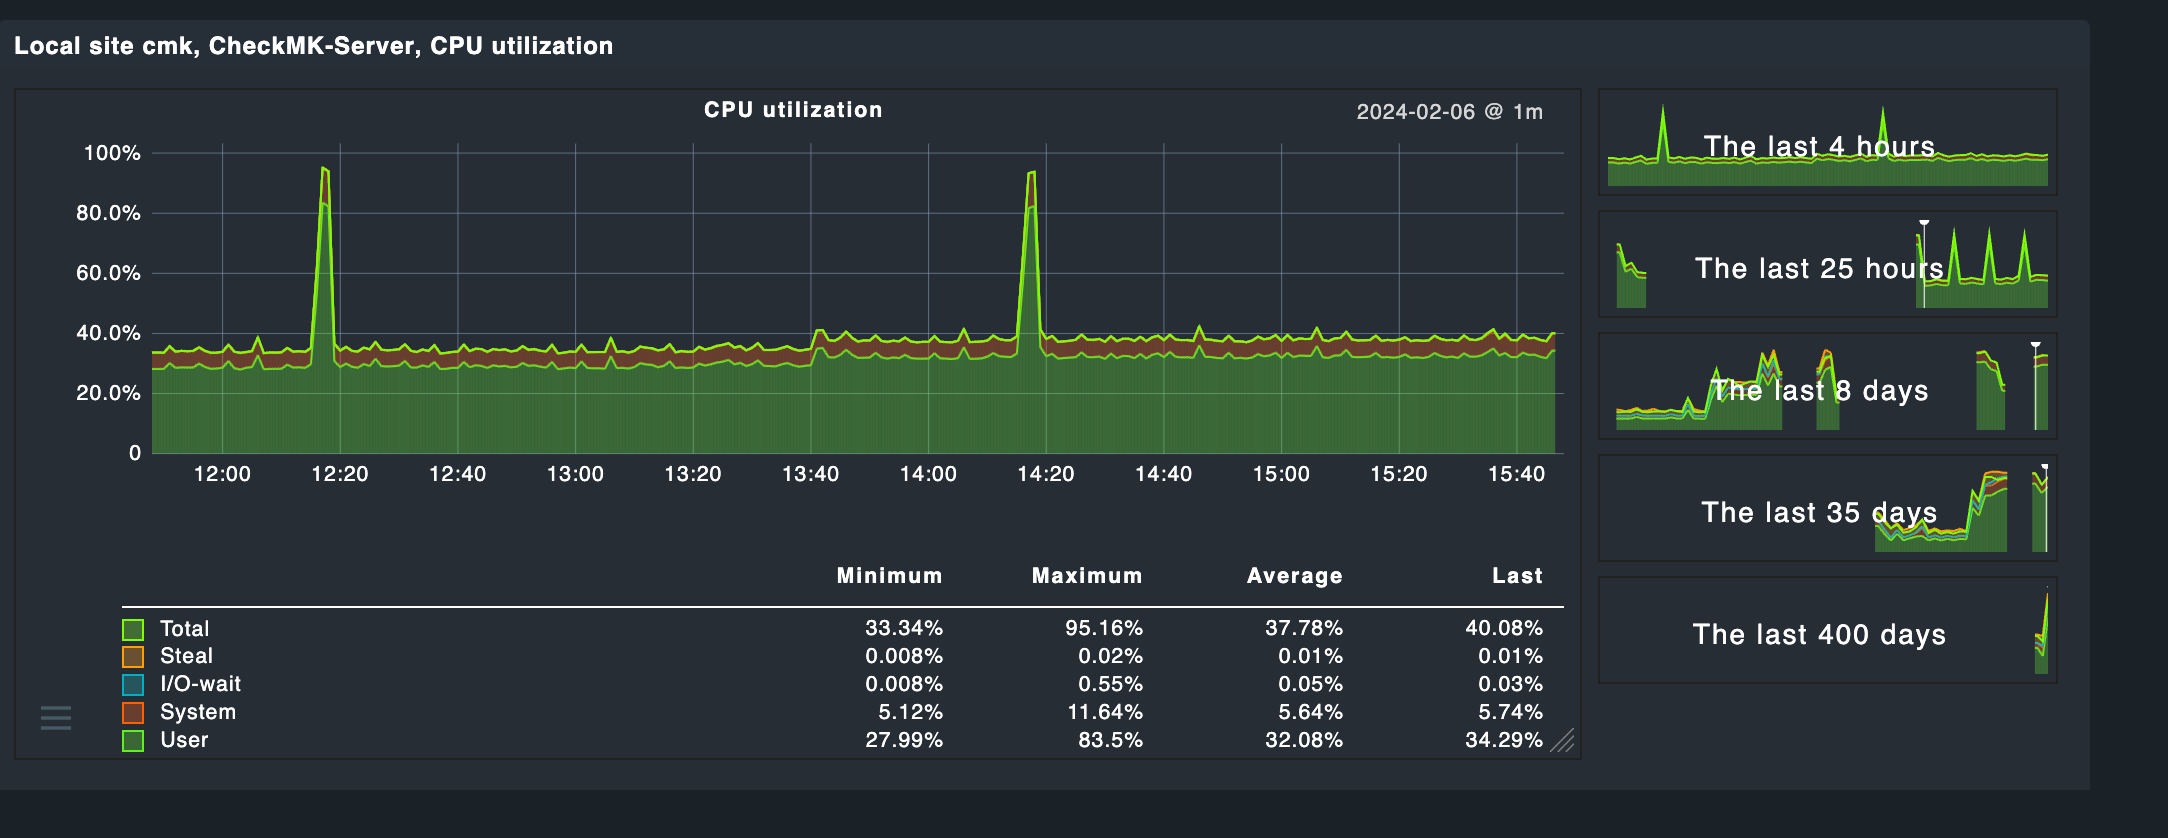
So I’m getting less only 50% CPU utilisation on my CheckMK raw instance.
Currently I’m running it on AWS from a docker container in an EC2 instance on an m6i.xlarge (4 vCPU and 16 RAM). I know that the RAM is not needed and will probably move to a compute optimised instance. Although I suspect I’ll still face the same issue - High load with less than 50% CPU utilisation (screenshots below). Is it possible to make the checks run in paralel on or in groups on the raw version (Example first 50 hosts run in 1 minute, than on the 2nd minute the next 50 hosts run, not all at once every minute).
Currently I’m running 1500 services and 150 hosts, but I’ll be adding over 4x the amount of services
and probably double the hosts.
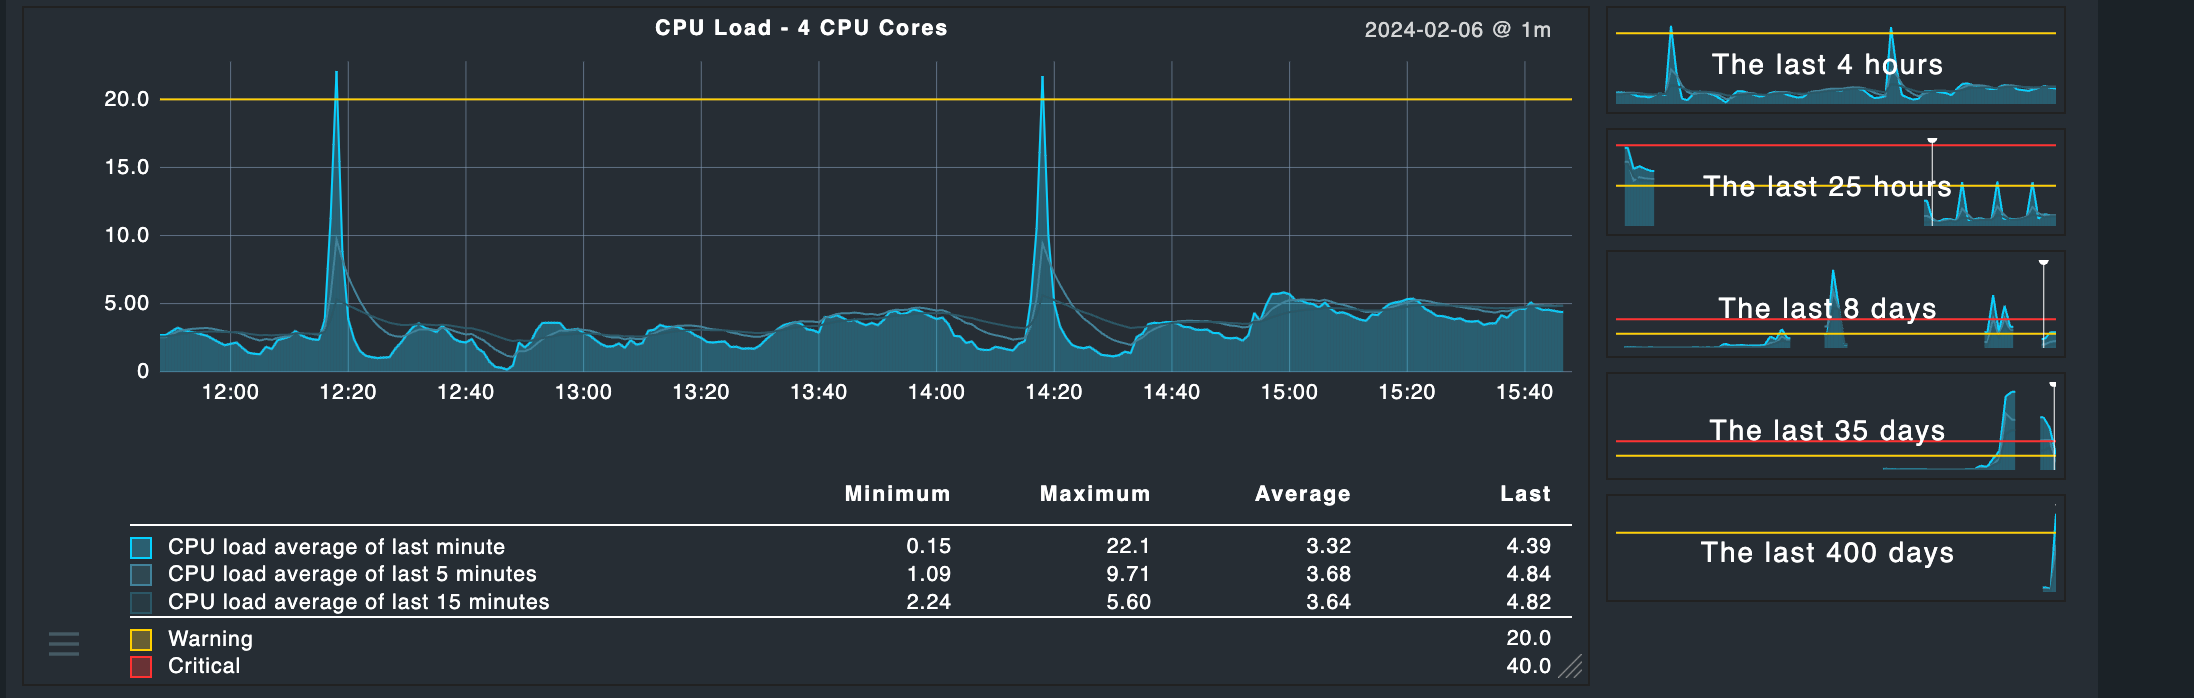
Adding more hosts make the system unstable (UI starts to begin slugish) and makes the load go to 20, 25, 30.
This is a Nagios issue. You can extend the check interval for the Check_MK service check (that pulls the agent data) to 2 or 3 minutes.
The general recommendation is to leave Nagios and go with the Enterprise edition with more than 100 hosts.
Anither solution would be to create multiple sites. Each runs its own Nagios core. You would have to distribute your hosts evenly across the sites.
Wont extending the check interval only decrease the number of times the hosts and services get checked? This sounds to be beneficial only when I’m getting CPU limited (100% not 50%, I may be completely wrong on how I understand this). Also if I go with running multiple sites, can I specify running one site after another?
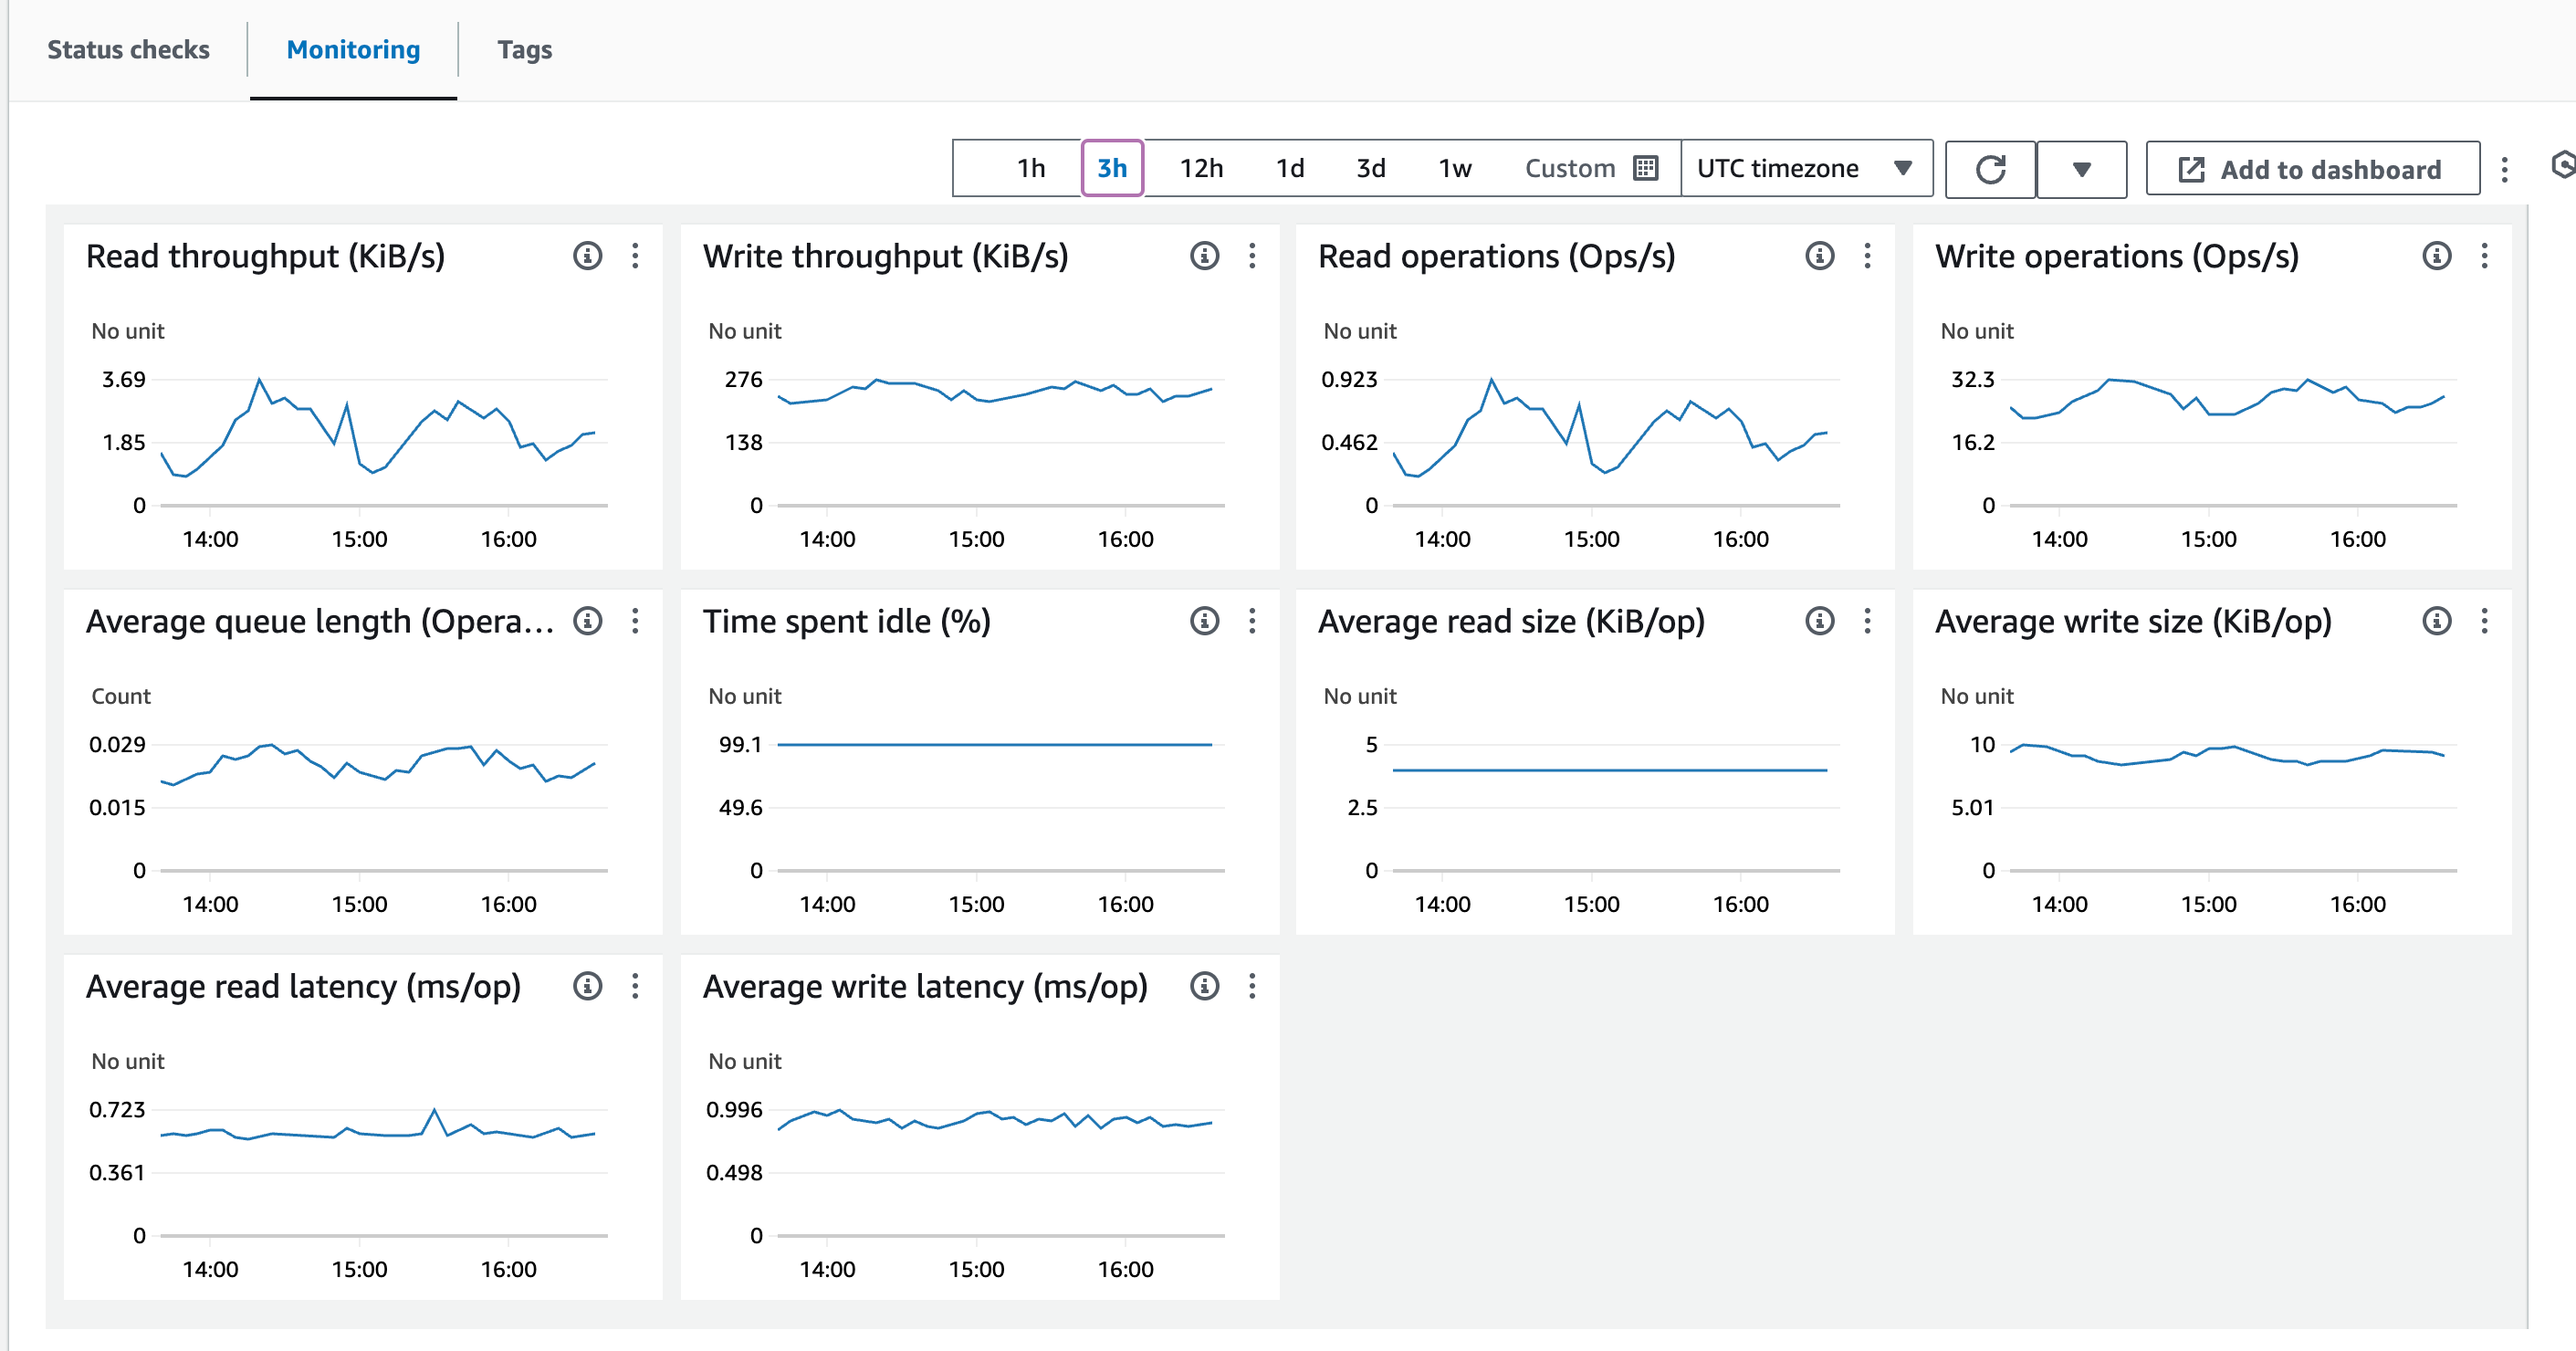
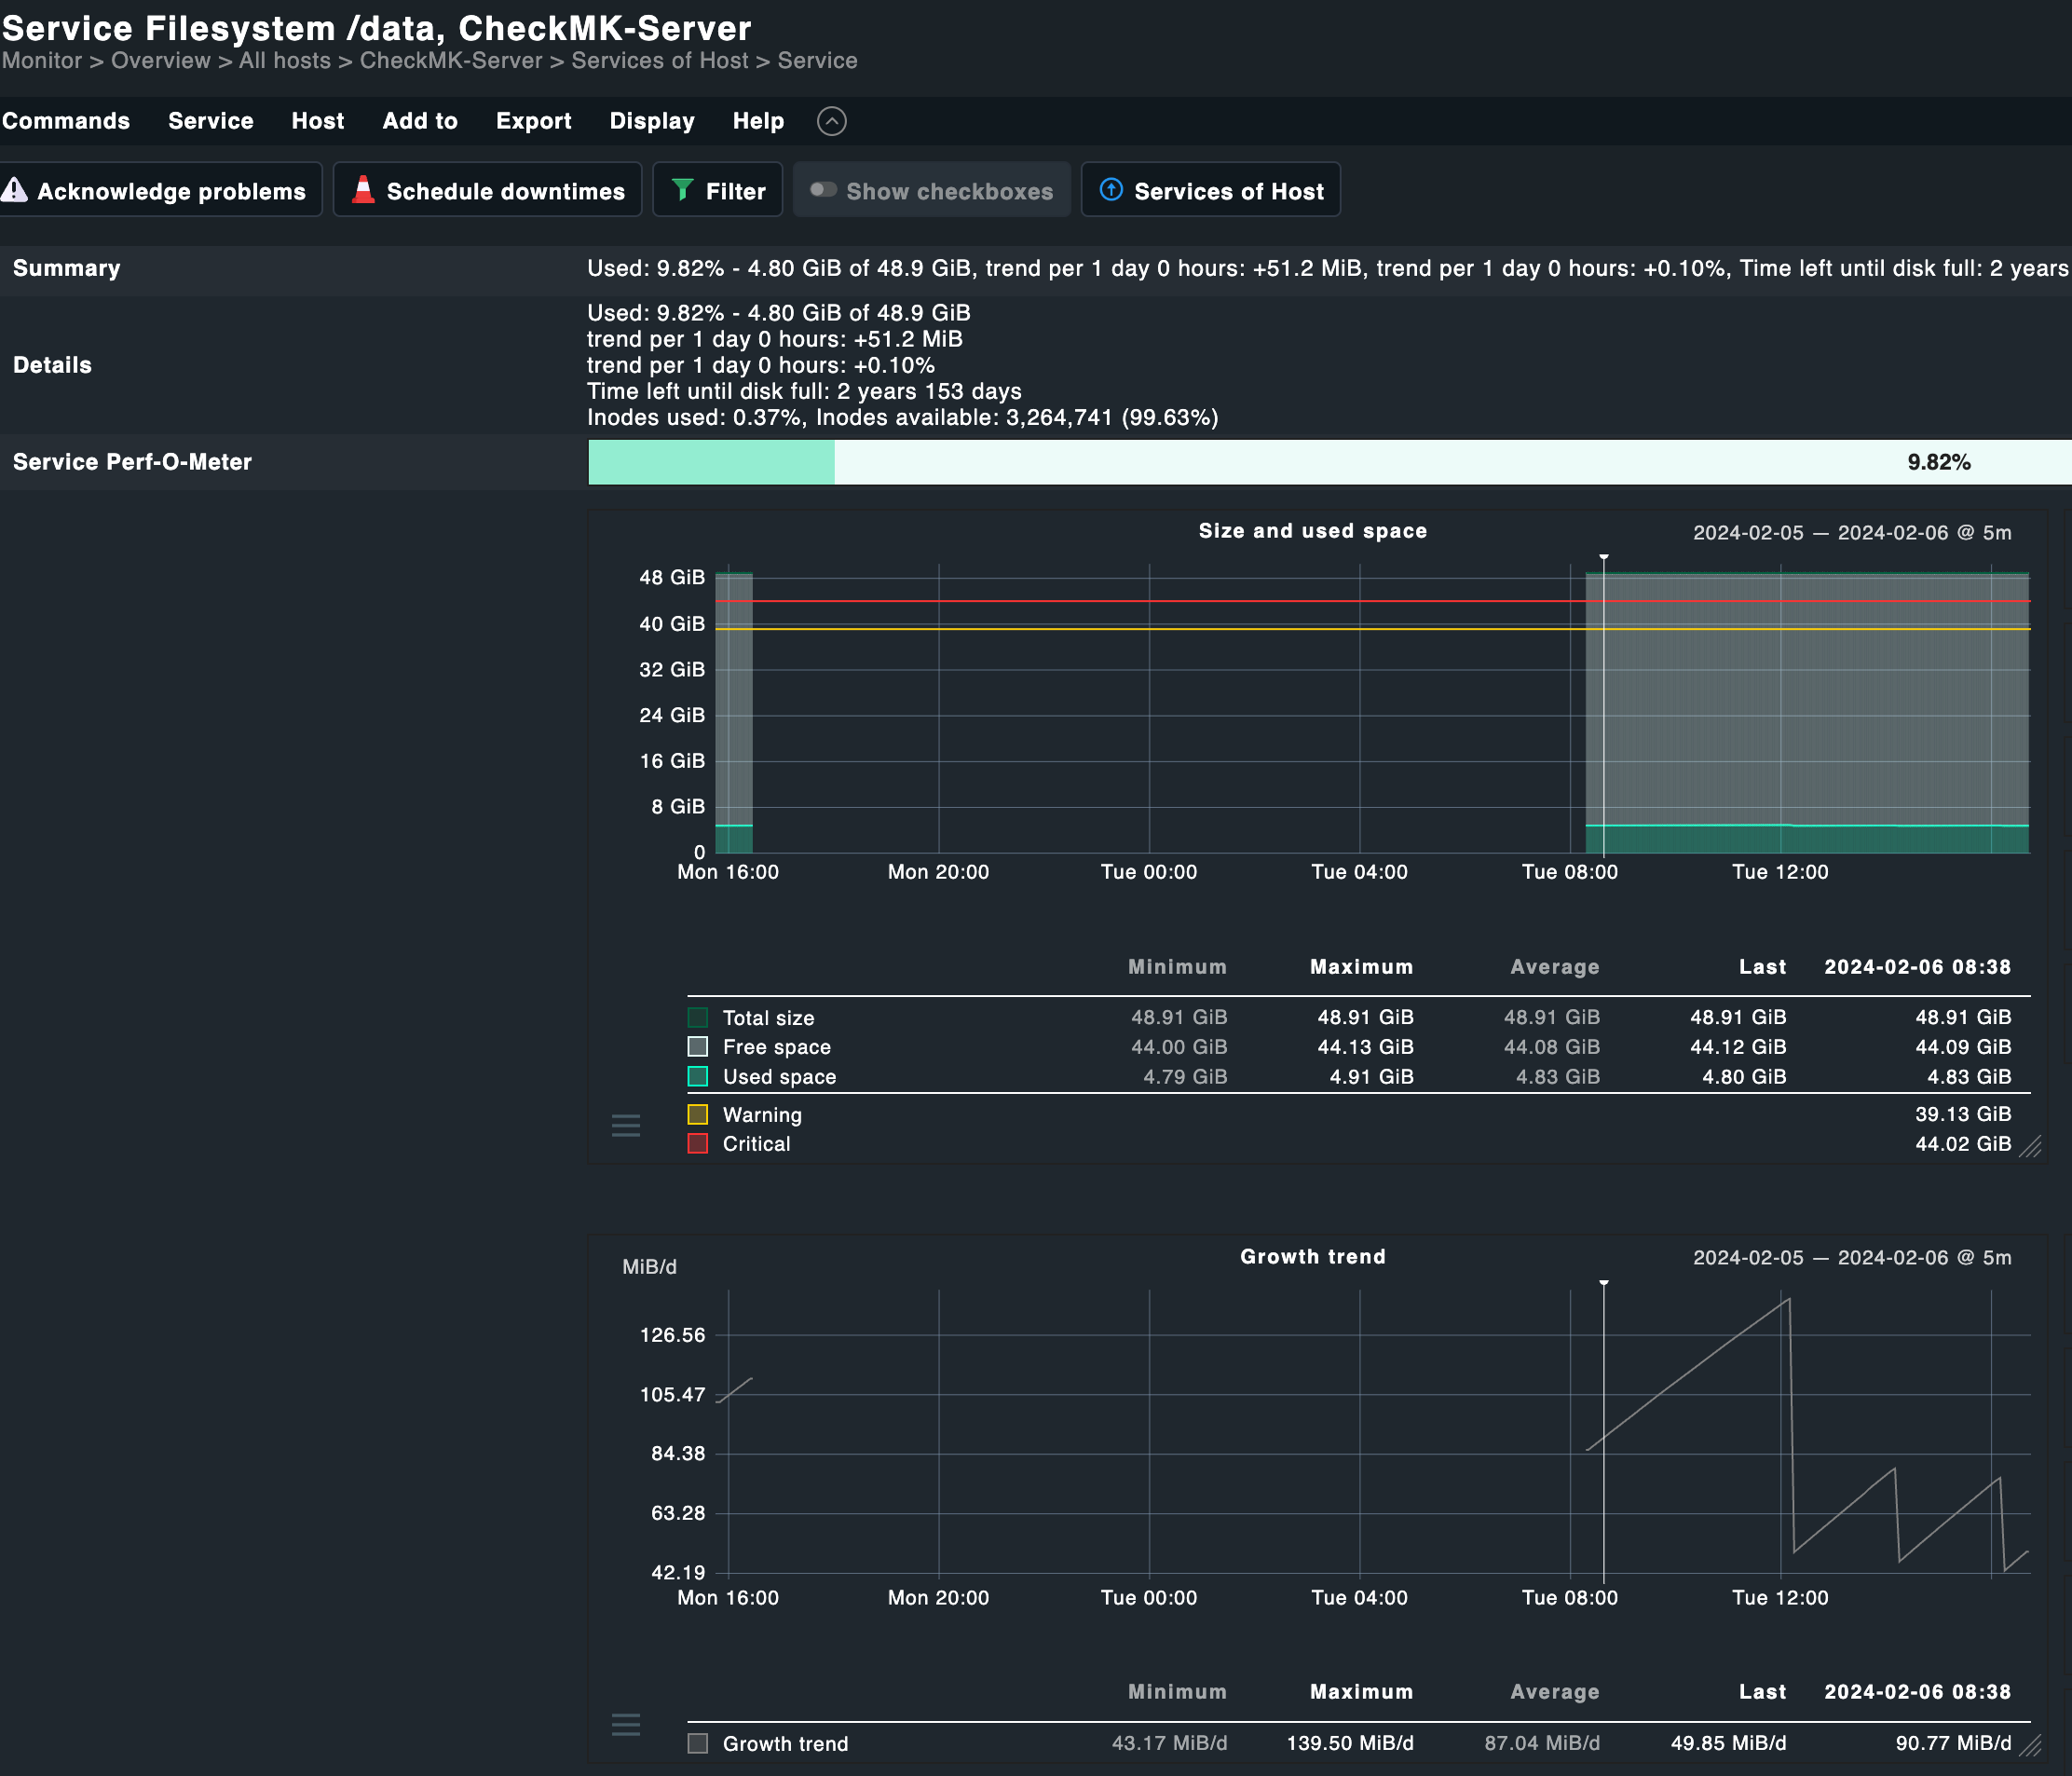
It looks more like an I/O issue on your machine. A load of 3,5 in average with 4 cores and only 40% utilization means that your processes need to wait for execution.
If it is a disc or network I/O problem, is not possible to say with the shown data.
Don’t increase - you need to decrease it
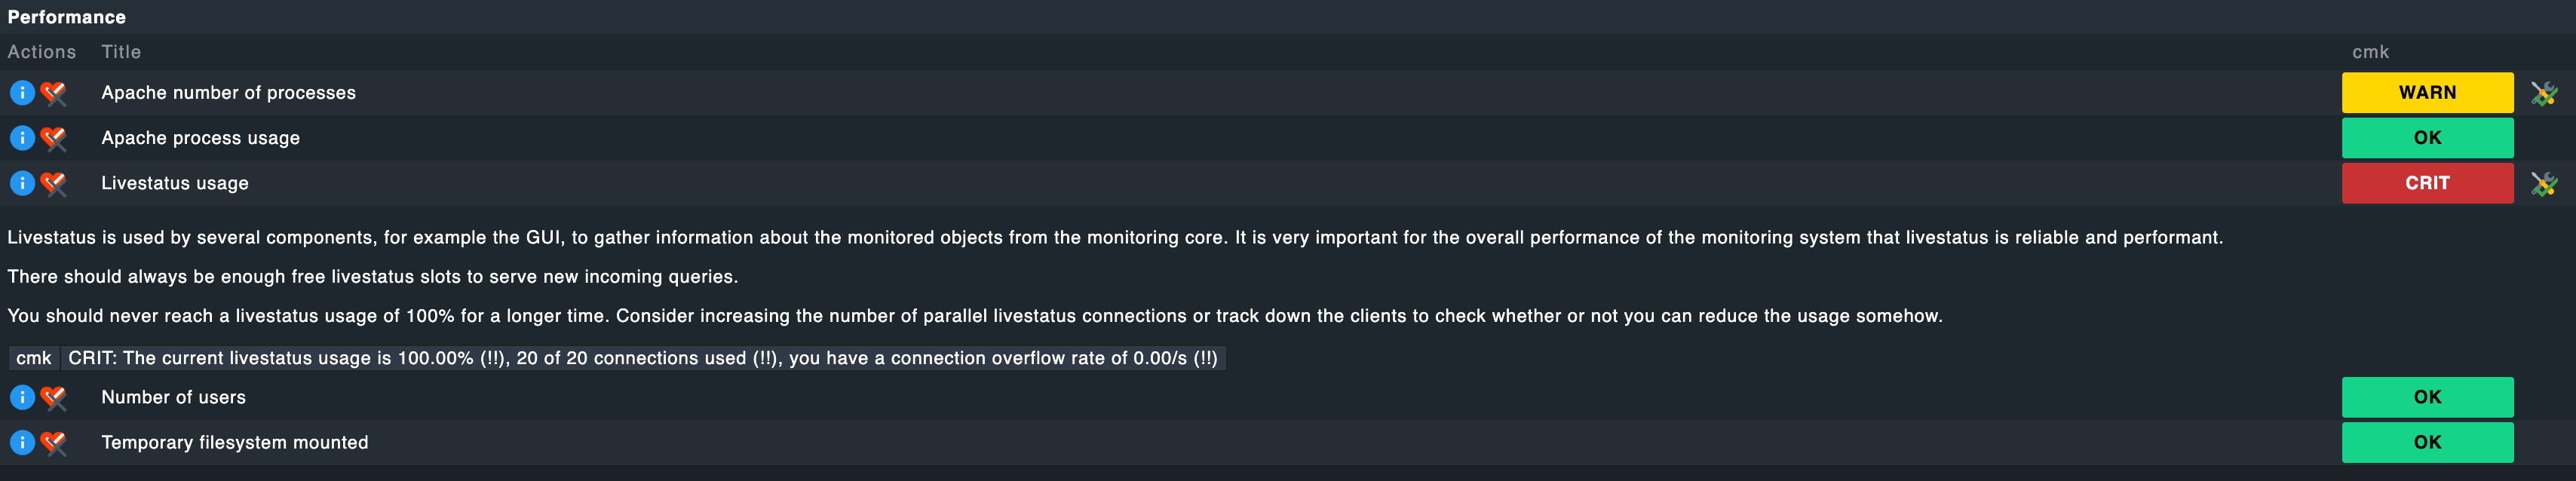
The livestatus 100% is normal für RAW edition. There is no real livestatus usage.
This is only usable inside enterprise with CMC core.
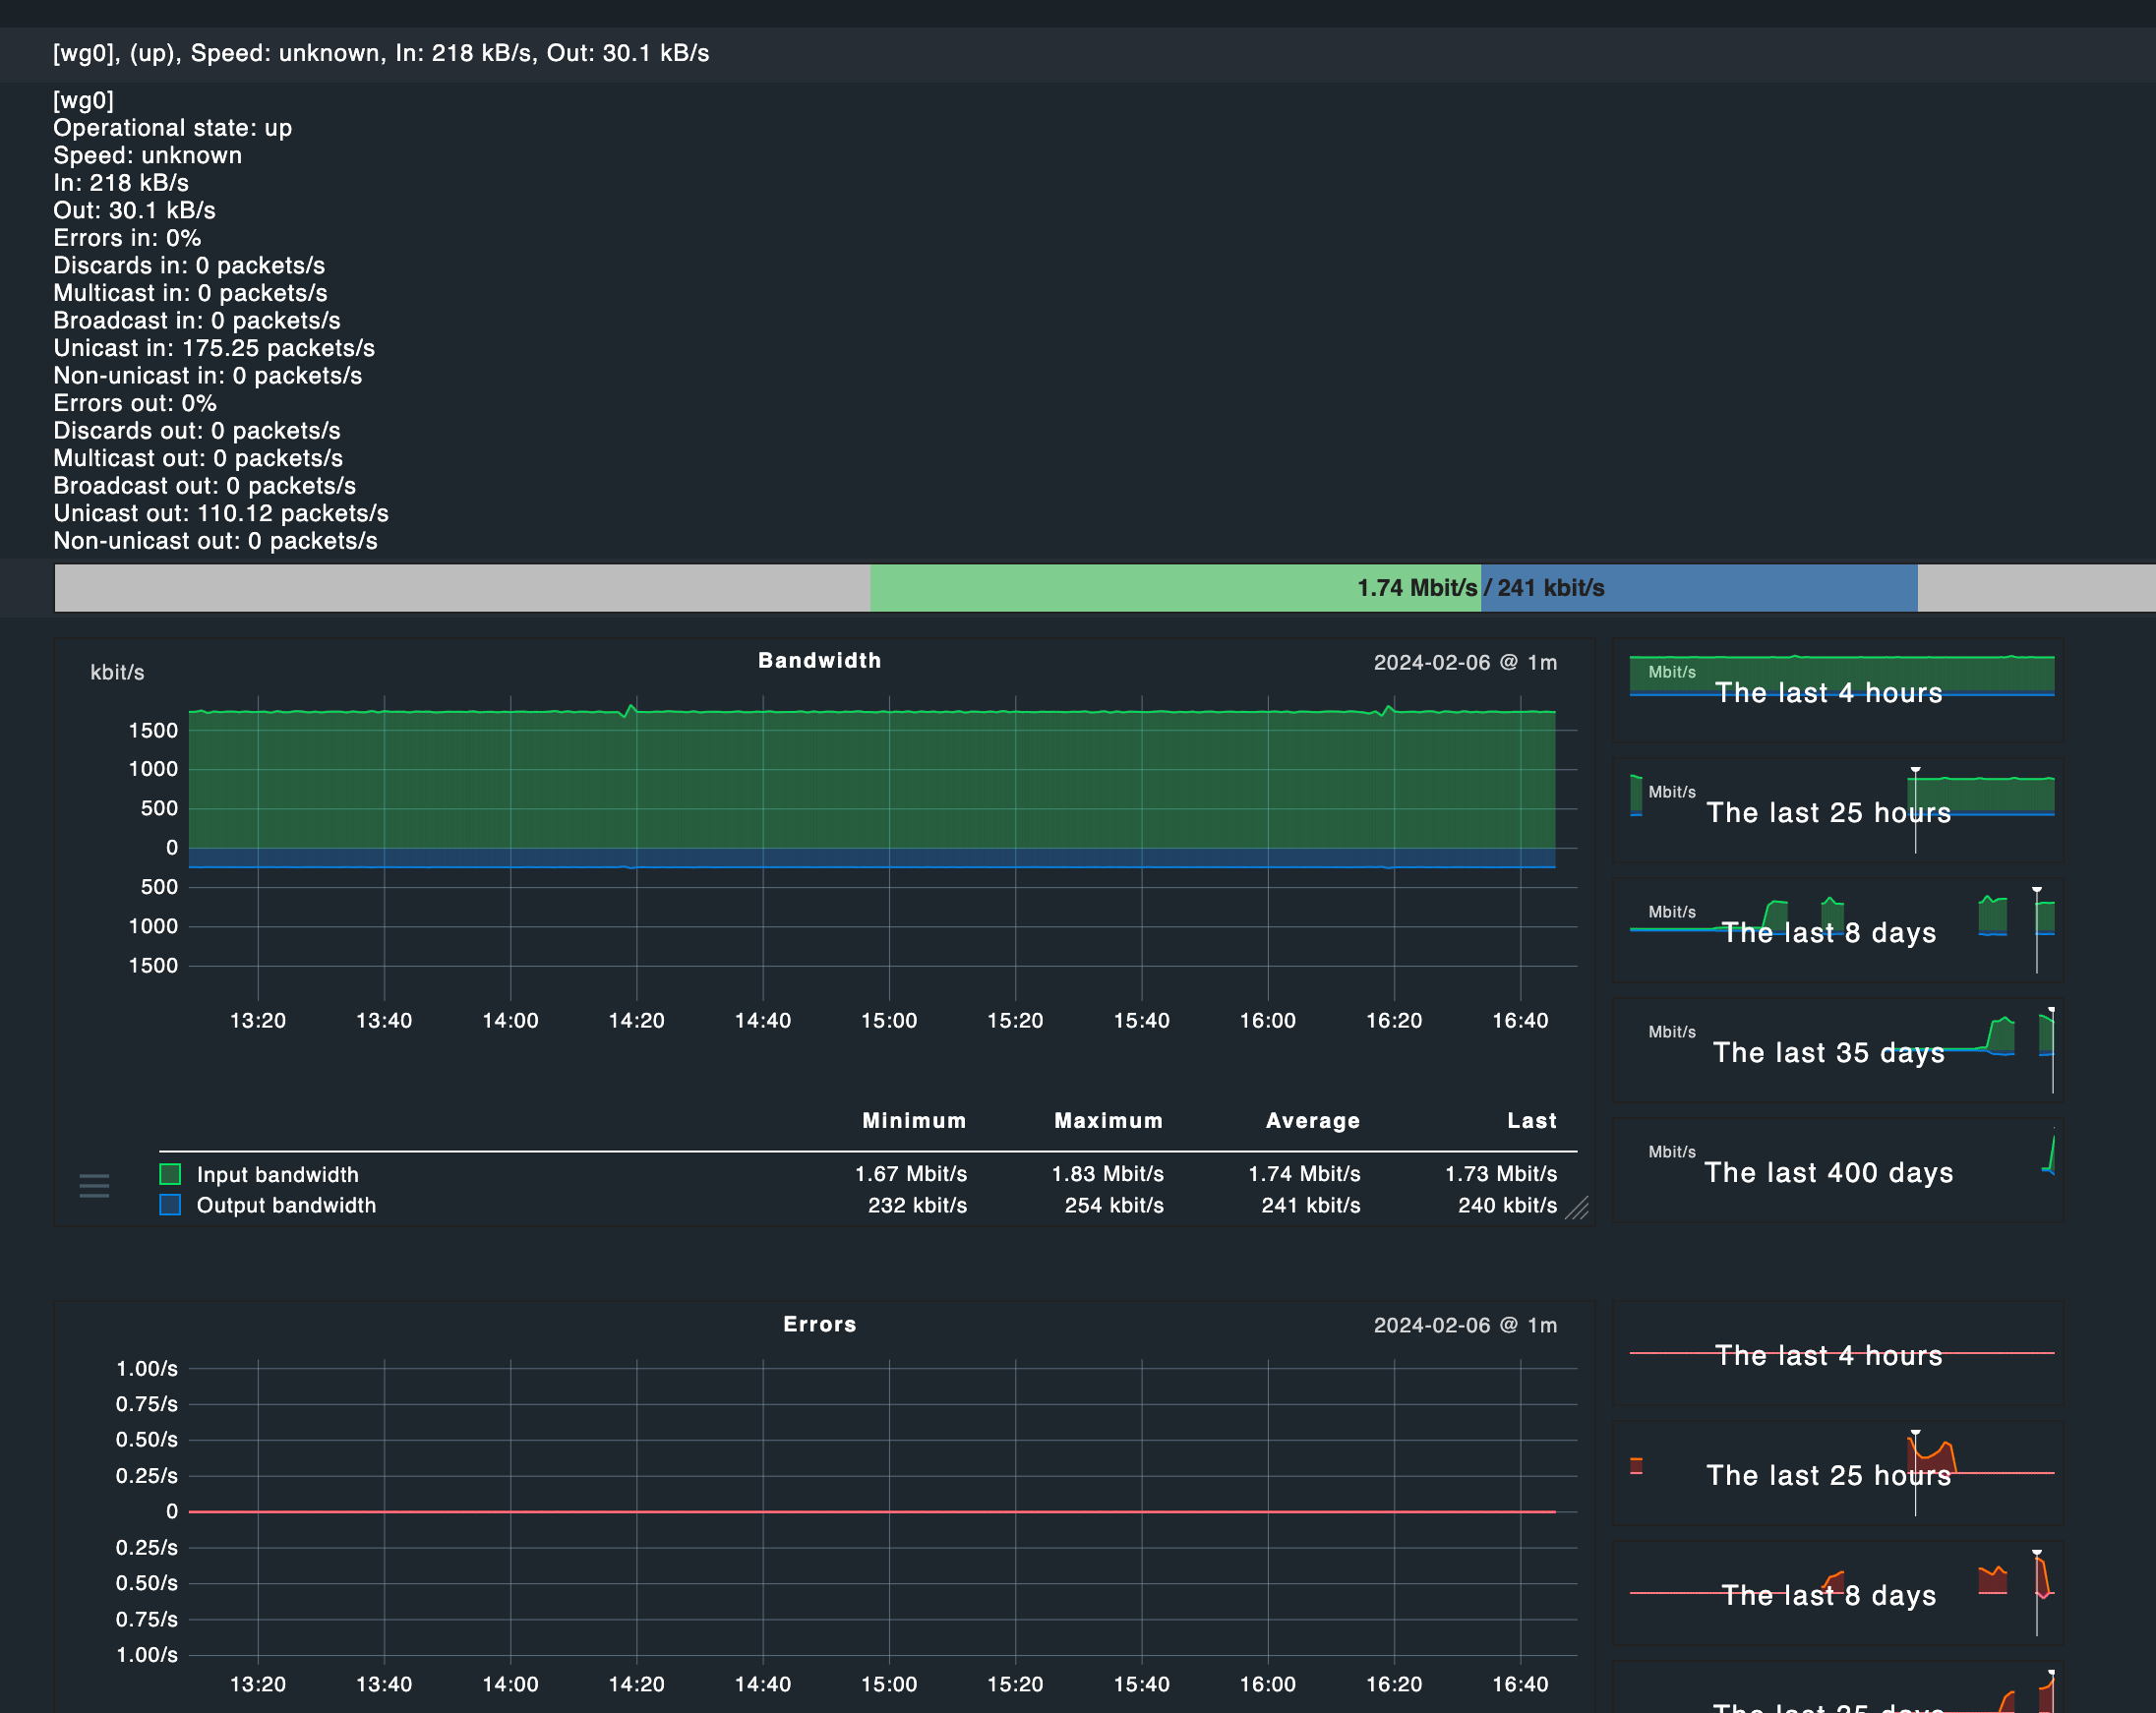
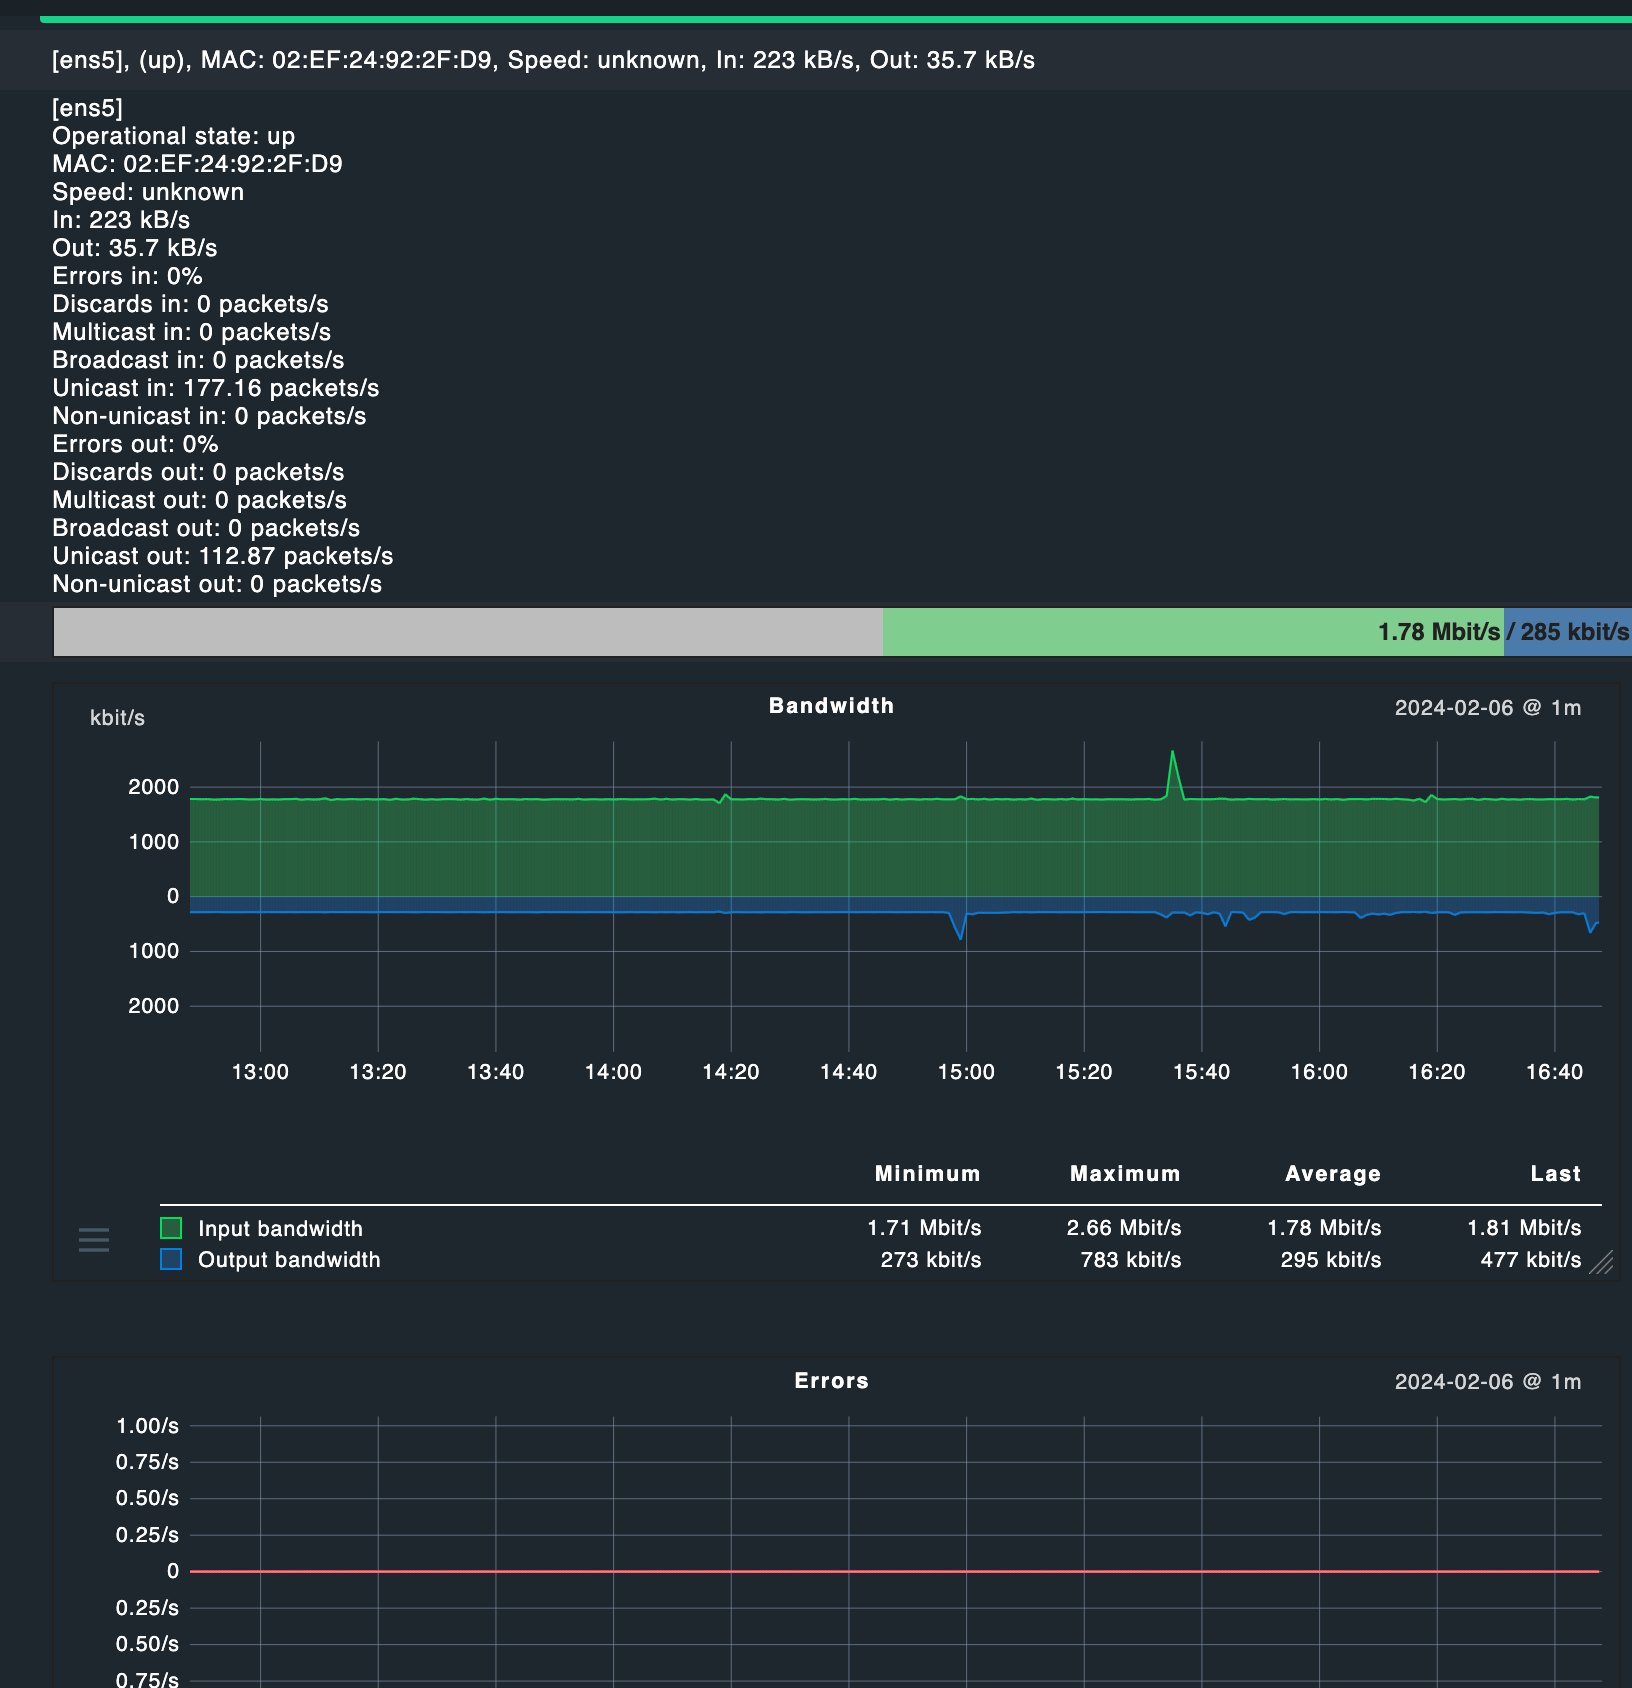
Network doesn’t feel to be a bottleneck as well, the instance should be able to cover 10 or 12.5GBit of network traffic, which by the looks is less than 1% currently. (Also I’m using Wireguard to connect, but I don’t think this should be causing issues.)
This topic was automatically closed 365 days after the last reply. New replies are no longer allowed. Contact an admin if you think this should be re-opened.