CMK version:2.2.0p22
OS version: official docker image
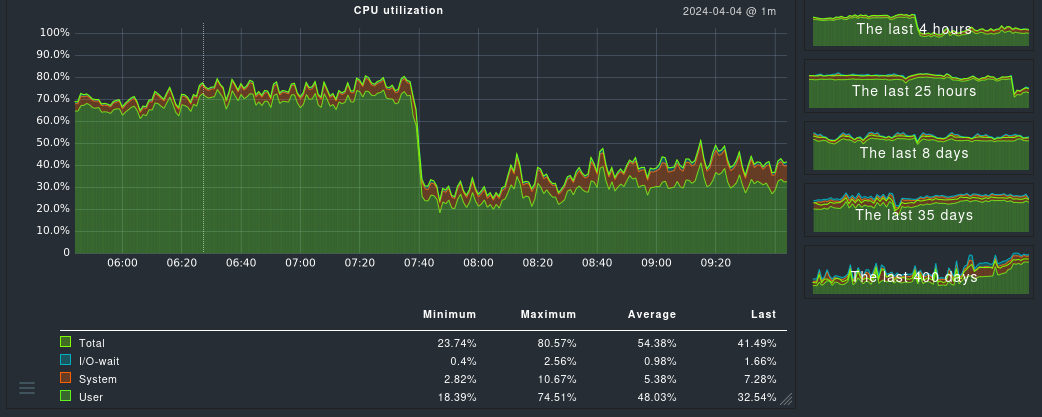
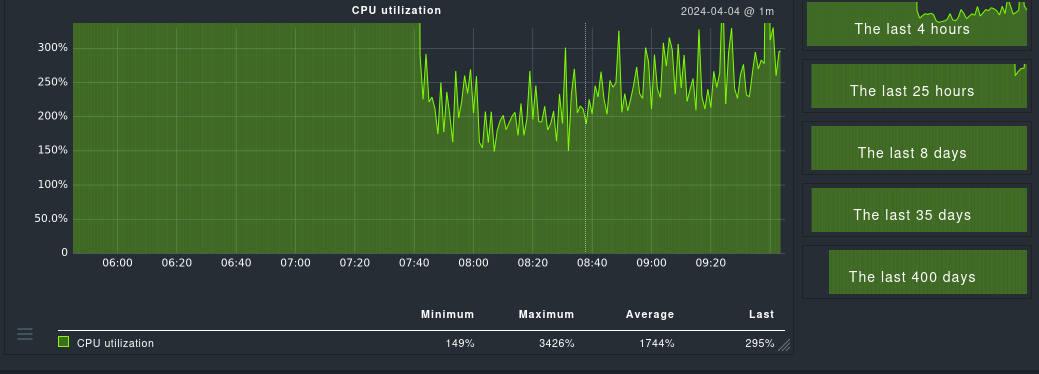
its almost a year ago since i posted this CPU utilisation graph on docker containers and the docker cpu-utilisation graph changed a bit. The Scaling sometimes is now over 100% and some peaks are visable but still there is a huge cut in the graph.
see the following 2 screenshots where the first one is a bare metal machine and the second one is a docker container. On the docker container graph you can see the maximum is 3426% but the scale cuts somewhere between 300% and 400%. also from 400 days to 8 days timeframe there is no peak or movement visable. I guess there is still something wrong with the autoscaling.
maybe its possible to read the available cores from docker cgroups inside container to do the same calculation as on bare metal, then no scaling above 100% should be needed.
CMK Version: 2.2.0p22