HI All,
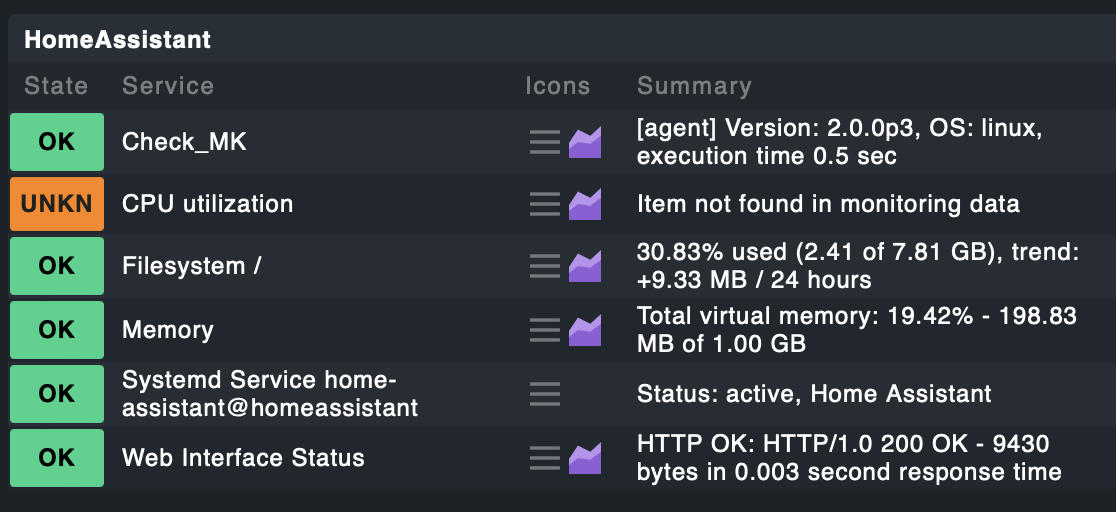
I have recently noticed that the CPU Utilization check of one of my servers is now giving as result “Item not found in monitoring data” and is in unknown status.
Other checks works without any issue and this check also worked without issue for about a month.
(Will post a second screenshot in the comment as I can only post one image per post)
I thought it was an issue with the CMK Agent so I verified that it was running (other checks works too), restarted it, restarted the whole server, removed and installed again; nothing changed.
Do someone have some idea what may be the cause and how to solve it?
Also, I do have other servers that are monitored via the agent the same way this one is but do not give me any problems.
CMK version: 2.0.0p3
CMK OS version: Centos 8 on Linux Container (Proxmox)
Monitored Server OS version: Ubuntu 20.04 on Linux Container (Proxmox)
Monitored Server Agent Version: 2.0.0p3
Output of “cmk --debug -vvn hostname”: (If it is a problem with checks or plugins):
OMD[check_mk]:~$ cmk --debug -vvn HomeAssistant
Checkmk version 2.0.0p3
Try license usage history update.
Try aquire lock on /omd/sites/check_mk/var/check_mk/license_usage/next_run
Got lock on /omd/sites/check_mk/var/check_mk/license_usage/next_run
Try aquire lock on /omd/sites/check_mk/var/check_mk/license_usage/history.json
Got lock on /omd/sites/check_mk/var/check_mk/license_usage/history.json
Next run time has not been reached yet. Abort.
Releasing lock on /omd/sites/check_mk/var/check_mk/license_usage/history.json
Released lock on /omd/sites/check_mk/var/check_mk/license_usage/history.json
Releasing lock on /omd/sites/check_mk/var/check_mk/license_usage/next_run
Released lock on /omd/sites/check_mk/var/check_mk/license_usage/next_run
Loading autochecks from /omd/sites/check_mk/var/check_mk/autochecks/HomeAssistant.mk
+ FETCHING DATA
  Source: SourceType.HOST/FetcherType.TCP
[cpu_tracking] Start [7feb720d6b20]
Connecting via TCP to 172.16.70.250:6556 (5.0s timeout)
[TCPFetcher] Fetch with cache settings: DefaultAgentFileCache(path=PosixPath('/omd/sites/check_mk/tmp/check_mk/cache/HomeAssistant'), max_age=0, disabled=False, use_outdated=False, simulation=False), Cache enabled: False
[TCPFetcher] Execute data source
Reading data from agent
Output is not encrypted
Write data to cache file /omd/sites/check_mk/tmp/check_mk/cache/HomeAssistant
Try aquire lock on /omd/sites/check_mk/tmp/check_mk/cache/HomeAssistant
Got lock on /omd/sites/check_mk/tmp/check_mk/cache/HomeAssistant
Releasing lock on /omd/sites/check_mk/tmp/check_mk/cache/HomeAssistant
Released lock on /omd/sites/check_mk/tmp/check_mk/cache/HomeAssistant
Closing TCP connection to 172.16.70.250:6556
[cpu_tracking] Stop [7feb720d6b20 - Snapshot(process=posix.times_result(user=0.0, system=0.0, children_user=0.0, children_system=0.0, elapsed=0.5))]
  Source: SourceType.HOST/FetcherType.PIGGYBACK
[cpu_tracking] Start [7feb720d6fd0]
No piggyback files for 'HomeAssistant'. Skip processing.
No piggyback files for '172.16.70.250'. Skip processing.
[PiggybackFetcher] Fetch with cache settings: NoCache(path=PosixPath('/omd/sites/check_mk/tmp/check_mk/data_source_cache/piggyback/HomeAssistant'), max_age=0, disabled=False, use_outdated=False, simulation=False), Cache enabled: False
[PiggybackFetcher] Execute data source
[cpu_tracking] Stop [7feb720d6fd0 - Snapshot(process=posix.times_result(user=0.0, system=0.0, children_user=0.0, children_system=0.0, elapsed=0.0))]
[cpu_tracking] Start [7feb720d6fd0]
+ PARSE FETCHER RESULTS
  Source: SourceType.HOST/FetcherType.TCP
No persisted sections loaded
  -> Add sections: ['check_mk', 'cifsmounts', 'df', 'diskstat', 'job', 'labels', 'lnx_if', 'local', 'lxc_container_cpu', 'md', 'mem', 'mounts', 'nfsmounts', 'postfix_mailq', 'postfix_mailq_status', 'ps_lnx', 'systemd_units', 'tcp_conn_stats', 'uptime', 'vbox_guest']
  Source: SourceType.HOST/FetcherType.PIGGYBACK
No persisted sections loaded
  -> Add sections: []
Received no piggyback data
Loading item states
Try aquire lock on /omd/sites/check_mk/tmp/check_mk/counters/HomeAssistant
Got lock on /omd/sites/check_mk/tmp/check_mk/counters/HomeAssistant
Releasing lock on /omd/sites/check_mk/tmp/check_mk/counters/HomeAssistant
Released lock on /omd/sites/check_mk/tmp/check_mk/counters/HomeAssistant
CPU utilization      Item not found in monitoring data
Filesystem /         30.83% used (2.41 of 7.81 GB), trend: +9.30 MB / 24 hours
Memory               Total virtual memory: 19.4% - 198.64 MB of 1.00 GB
Systemd Service home-assistant@homeassistant Status: active, Home Assistant
No piggyback files for 'HomeAssistant'. Skip processing.
No piggyback files for '172.16.70.250'. Skip processing.
[cpu_tracking] Stop [7feb720d6fd0 - Snapshot(process=posix.times_result(user=0.0, system=0.009999999999999995, children_user=0.0, children_system=0.0, elapsed=0.009999997913837433))]
[agent] Version: 2.0.0p3, OS: linux, execution time 0.5 sec | execution_time=0.510 user_time=0.000 system_time=0.010 children_user_time=0.000 children_system_time=0.000 cmk_time_agent=0.500
Many thanks to anyone who can help.
Gianluca
