CPU Utilization on Windows HyperV Hosts

The Checkmk agent uses Windows Counter ID 238 (Processor) for collecting CPU Utilization. This is fine, however on VM hosts this only captures the CPU utilization of the host itself, excluding overhead from VMs. This is not very useful when trying to monitor the actual host.

Is it possible to change this in config somewhere to a different counter ID. 1950 Processor Utility for example captures the total CPU utilization. I tried to just change the counter ID in the check_mk.yml file, however this results in an error:
Missing monitoring data for check plugins: winperf_processor_utilWARN

Thanks.

Anyone have any advice on this?

What is not possible is to use the other counter for the same check. That leads to the error you saw in your test.
First step is - output to counter as a new winperf section inside the agent.
For this it is important to query the base counter. With your counter ID 1950 the base counter is Processor Information (1896).
I checked this here with one HyperV and get some output that looks valid.

<<<winperf_cpu_utility>>>
1623219255.88 1896 10000000
14 instances: _Total 0,_Total 0,11 0,10 0,9 0,8 0,7 0,6 0,5 0,4 0,3 0,2 0,1 0,0
2 12860697382812 12860697382812 12989412187500 12860962343750 13162246093750 12850489375000 13138331250000 12747228906250 12898796875000 12843930781250 13015654218750 12767657343750 13138528281250 11915130937500 100nsec_timer_inv
4 385956510416 385956510416 375546875000 377756718750 238123906250 403052187500 260410937500 476954843750 465568125000 415944218750 393515468750 465852187500 264865937500 493886718750 100nsec_timer
6 403580052083 403580052083 285274375000 411514375000 249863437500 396691875000 251491250000 426049687500 285868437500 390358593750 241063906250 416724062500 246839375000 1241221250000 100nsec_timer
8 549681854 549681854 462848949 792624216 377881443 890323163 418043775 952773201 398861068 1105946682 369788912 1143935677 336623743 1889965617 counter
10 68953893229 68953893229 209843750 1341250000 206718750 1402031250 207968750 2287968750 290937500 3240468750 182031250 3242812500 457343750 814377343750 100nsec_timer
12 6172395833 6172395833 2754375000 4341093750 2295468750 4587812500 2264375000 6436718750 2289687500 4379531250 1859375000 4482187500 1925781250 36452343750 100nsec_timer
14 2352635489 2352635489 10265490 45843638 8994848 51209283 8693292 62885367 19205587 304821704 7447864 312045177 11623244 1509599995 counter
16 0 0 0 0 0 0 0 0 0 0 0 0 0 0 rawcount
18 12860697382812 12860697382812 12989412187500 12860962343750 13162246093750 12850489375000 13138331250000 12747228906250 12898796875000 12843930781250 13015654218750 12767657343750 13138528281250 11915130937500 100nsec_timer
20 269117377917 269117377917 178063219235 284144976065 167800104086 277345592991 175907839429 318714597698 279105777650 283917668801 199653830863 315817235895 177488626963 571449065336 100nsec_timer
22 12480554932054 12480554932054 12734469832265 12450676680691 12928770499244 12430261662039 12885288667970 12268320869206 12493929017651 12410632324825 12747223329316 12305114178368 12897802598622 11214169524455 100nsec_timer
24 0 0 0 0 0 0 0 0 0 0 0 0 0 0 100nsec_timer
26 2081689995 2081689995 102095062 212168809 95279242 221923252 93593665 232484569 106330138 214897368 93103502 231342616 91957953 386513819 bulk_count
28 5581950934 5581950934 325729640 500102622 240035795 578936467 280909542 615342324 242396044 753507527 229986369 796142139 207001568 811860897 bulk_count
30 0 0 0 0 0 0 0 0 0 0 0 0 0 0 bulk_count
32 12927553984375 12927553984375 13065135312500 12919142656250 13210458125000 12919928593750 13184991406250 12832019375000 12935128593750 12909500937500 13166359218750 12827456406250 13189584531250 11970942656250 100nsec_timer_inv
34 0 0 0 0 0 0 0 0 0 0 0 0 0 0 rawcount
36 2001 2001 2001 2001 2001 2001 2001 2001 2001 2001 2001 2001 2001 2001 rawcount
38 100 100 100 100 100 100 100 100 100 100 100 100 100 100 rawcount
40 0 0 1 1 1 1 1 1 1 1 1 1 1 1 rawcount
42 850693057 850693057 40742795 92231128 48306118 89497264 50372330 94695852 46052583 92371130 56312344 94098049 39755000 106258464 counter
44 152996067719664 152996067719664 12912533051500 12734821656756 13096570603330 12707607255030 13061196507399 12587035466904 12773034795301 12694549993626 12946877160179 12620931414263 13075291225585 11785618589791 type(20570500)
-1896 7663640929 7663640929 427824702 712271431 335315037 800859719 374503207 847826893 348726182 968404895 323089871 1027484755 298959521 1198374716 type(40030500)
48 7663640929 7663640929 427824702 712271431 335315037 800859719 374503207 847826893 348726182 968404895 323089871 1027484755 298959521 1198374716 bulk_count
50 6852576153834 6852576153834 5555438616238 6974575427621 4192308747459 7214763573751 4476523236057 8117590558305 6518786421720 7402903771171 5271003215255 8004134021979 4342886433893 14159999822562 average_bulk
-1896 1903759850 1903759850 1378128861 974185220 2299259675 3096260218 495009701 2354017541 1238025416 330079407 2986891073 955982236 3546368534 3190910328 average_base
54 6852576153834 6852576153834 5555438616238 6974575427621 4192308747459 7214763573751 4476523236057 8117590558305 6518786421720 7402903771171 5271003215255 8004134021979 4342886433893 14159999822562 average_bulk
-1896 2738283665 2738283665 2738283714 2738283713 2738283712 2738283703 2738283679 2738283657 2738283656 2738283647 2738283628 2738283627 2738283625 2738283623 average_base
58 1931775748544 1931775748544 1140009381005 1896993337399 1005526587850 1999348989748 1087664385940 2175908149044 1103442070911 2084933445715 975392479481 2167375998311 1074149625169 6470564531966 average_bulk
-1896 2738283665 2738283665 2738283714 2738283713 2738283712 2738283703 2738283679 2738283657 2738283656 2738283647 2738283628 2738283627 2738283625 2738283623 average_base
62 100 100 100 100 100 100 100 100 100 100 100 100 100 100 rawcount
64 0 0 0 0 0 0 0 0 0 0 0 0 0 0 rawcount
66 0 0 0 0 0 0 0 0 0 0 0 0 0 0 100nsec_timer

The line starting with number 54 is the counter you wanted.
In the third line you see all the instance names.
Now we need a check that processes this data :slight_smile:

Inside the yaml File the definition looks this way

winperf:
  enabled: yes
  counters:
    - Processor Information: cpu_utility

Thanks for that. How do I then visualize this in checkmk? I cannot find this data anywhere in the UI.

Also I couldn’t find any documentation on how this is supposed to work. Can you point me in the right direction?

That’s correct, without an own check who uses this data you will see nothing. As i have also some HyperV here inside a monitoring i will take a look how much work is to do for a check with this data.

Appreciate that. Let me know how you go.

Do you know why checkmk isn’t collecting this as the default CPU utilisation metric?

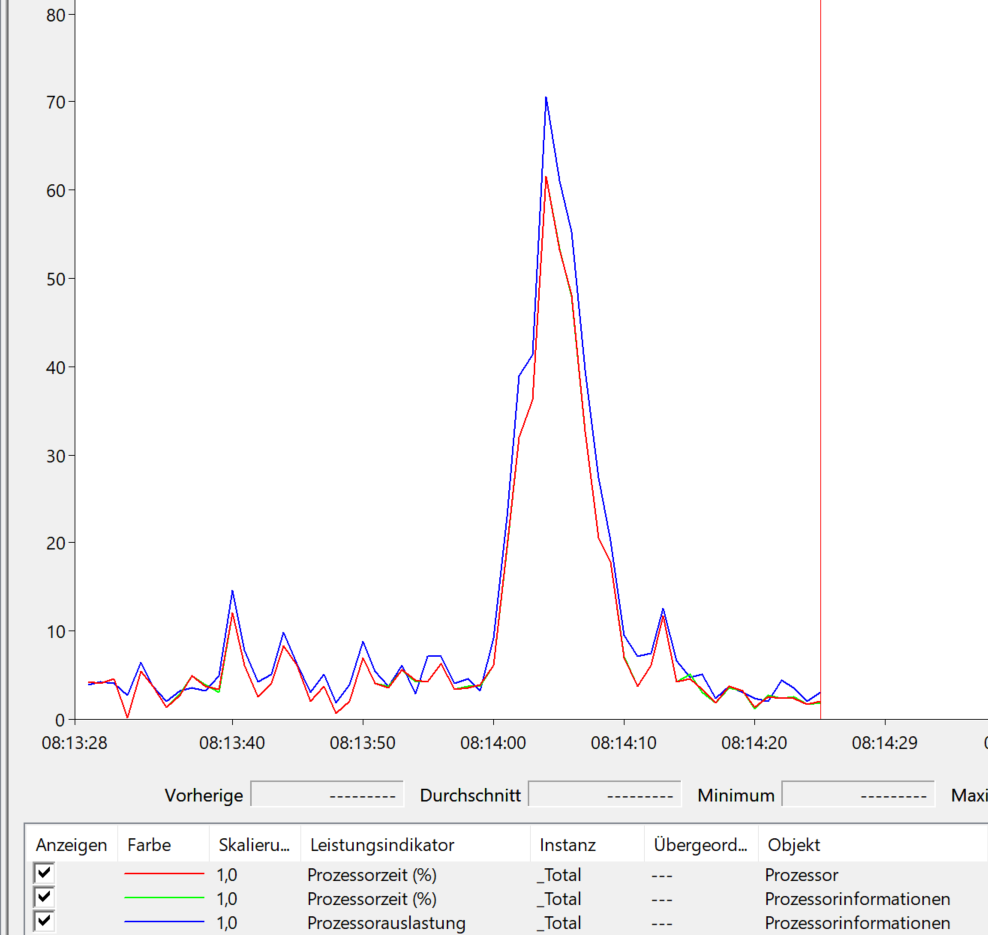
Processor and Processor Information are normally the same informations. The later one is only separated for each NUMA node.
If you look at booth perf counter objects inside Windows you should see the same values.
Here you see as an example that booth counters output the same


The green line is not good to see but it is also at the red and blue one.

The host where i get this example is also an HyperV enabled node.

Hmm okay. Let me know if you find a way to get total cpu utilisation into checkmk. I really want to be able to see the sum the host OS plus VM usage as total CPU utilisation as opposed to just the host OS.

I can’t think of many scenarios where you’d want to use this counter as the default. If anyone out there knows how to get this working, please let me know.

This topic was automatically closed 365 days after the last reply. New replies are no longer allowed. Contact an admin if you think this should be re-opened.