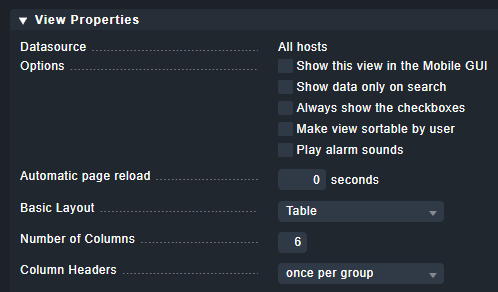
First, this is a view, not a dashboard.
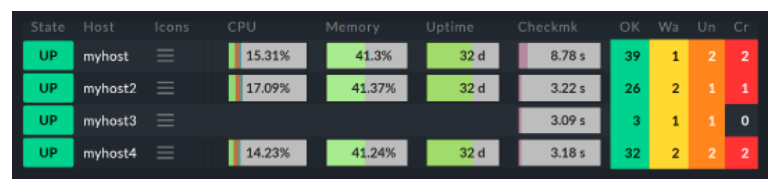
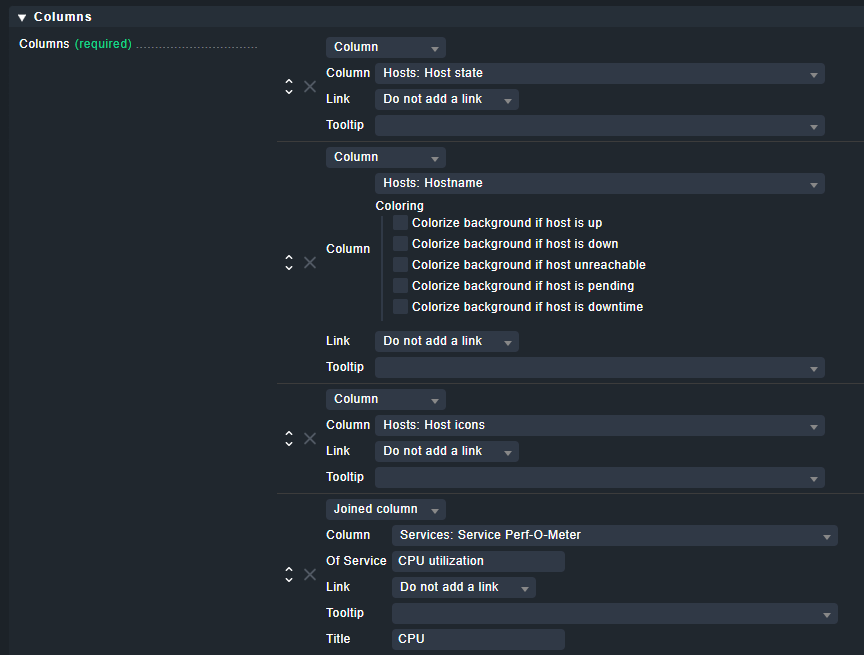
It uses “All hosts” as datasource. The perf-o-meters of the service checks CPU, Memory, Uptime and Checkmk are “joined columns” as they show service data (in the host view).
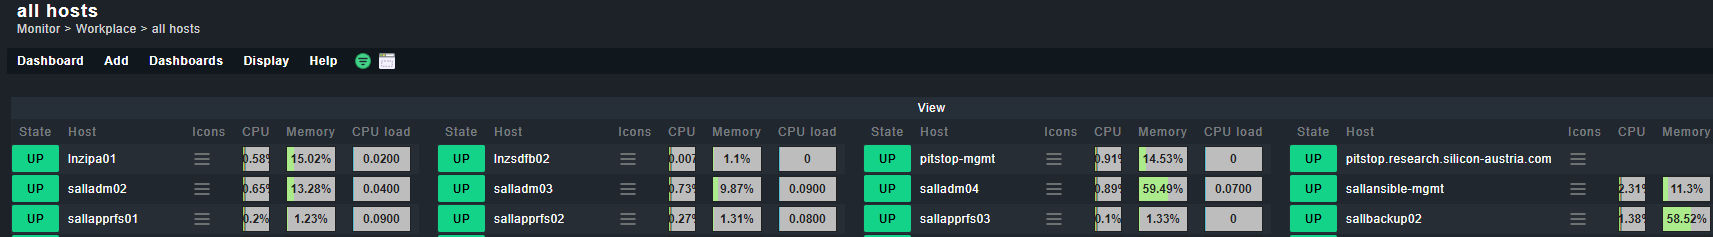
I think you should set the number of colunms to 1 instead of 6, then you will have a separate line for each host.
Regarding your second question I don’t have a clear answer for you, but maybe you could experiment with the basic layout option for the view. Maybe “table” isn’t the best option. There are serveral others you can try out.
On the other hand you might already be happy with your view if there is more space for each of the columns per line after setting the colunms option related to your first question.
This topic was automatically closed 365 days after the last reply. New replies are no longer allowed. Contact an admin if you think this should be re-opened.