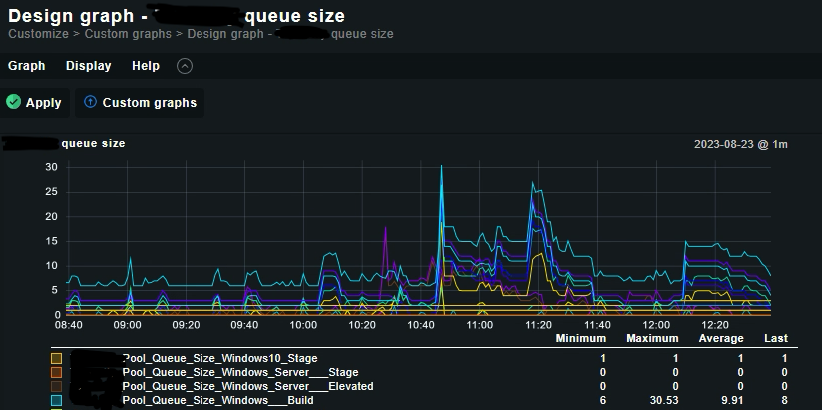
I have a question about creating dynamic charts from multiple metrics. I have a custom plugin that queries the service using REST API and add multiple metrics into one service. I made a custom graph that combines all these metrics into one graph. This solution works but any changes to the graph are not done dynamically but are created manually.
The second approach was that in the plugin I added the ability to create a graph according to instuctions from the site Writing your own check plug-ins
This also works, except that I can’t use wildcart to add all the metrics at once.
Solution with All metrics of same type on one graph doesn’t work too.
Do you have any idea how this can be solved dynamically so that when services are refreshed, the graph is also dynamically refreshed?
This topic was automatically closed 365 days after the last reply. New replies are no longer allowed. Contact an admin if you think this should be re-opened.