CMK version:
OS version: CentOS 7
Creating a plugin with some metric data and struggling to find the correct method to handle a few items.
Given metric data coming from an agent like this:
<<<broadworks_as:sep(0)>>>
{"ValidResponses":26787,"AuthChallenges":26961}
<<<>>>
In a metric configuration file located in $OMD_ROOT/local/share/check_mk/web/plugins/metrics/ I have defined metric_info:
metric_info["AuthChallenges"] = {
    "title": _l("Auth Challenges"),
    "unit": "count",
    "color": "34/a",
}
metric_info["ValidResponses"] = {
    "title": _l("Valid Responses"),
    "unit": "count",
    "color": "34/b",
}
AND graph_info
graph_info["bw_as_auth_challenges"] = {
    "title": _l("BW AS Auth Challenges"),
    "metrics": [
        ("AuthChallenges,60,*", "line", _l("Auth Challenges per Minute")),
        ("ValidResponses,60,*", "area", _l("Valid Responses per Minute")),
    ],
    "scalars": [
        ("ValidResponses,AuthChallenges,/,100,*", _l("Percentage")),
    ],
}
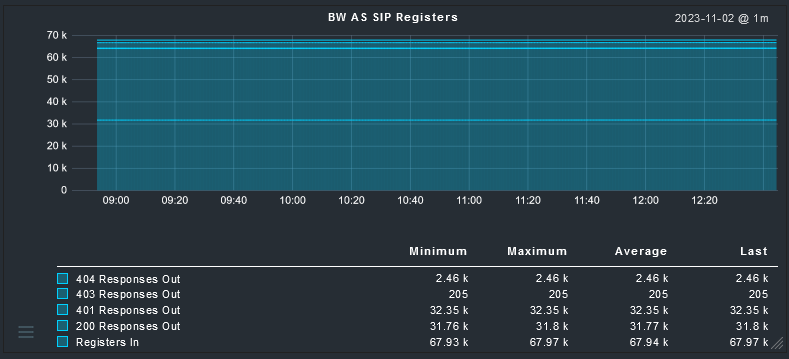
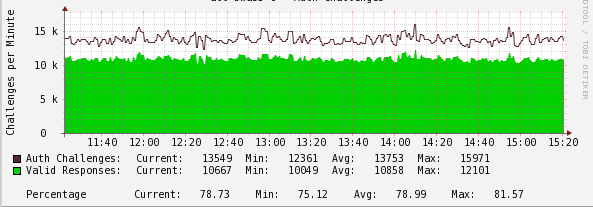
Trying to mimic a legacy cacti graph like this
In the Check_MK graph configuration I have a few questions I can’t figure out.
- I can’t seem to find the right placement to specify the scale of the number as the “K/1000” like I see as an option in the units.py file. Currently checkmk is showing it as exponential value.
- Is a scalars the appropriate way to add a metric not on the graph? e.g. Percentages
- Can a comment be added to the graph similar to the vertical “Challenges per Minute” on cacti image?
- General question, is defining a metric_info considered good practices since I did figured out I can specify color and title inline with the graph_info:metrics values.
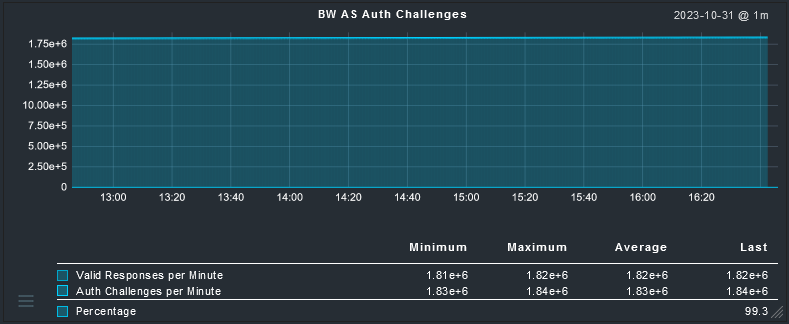
Current CheckMK Graph (dark mode)
Sincerely,
Scotsie