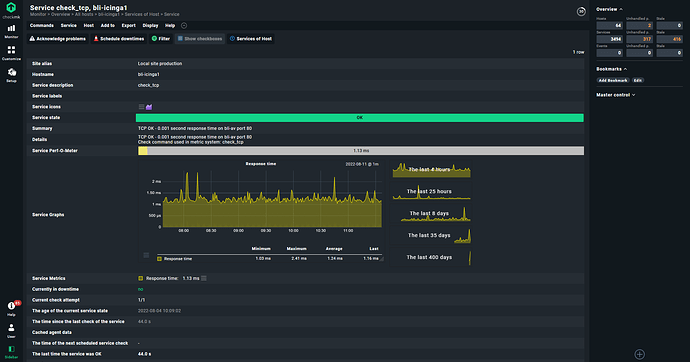
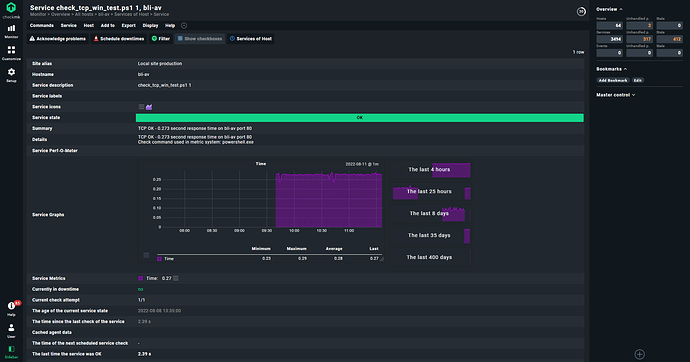
I currently have a custom MRPE powershell check that behaves similarly to the Nagios check_tcp plugin. I have it set up to output performance metric data for the response time. It is configured, working, and outputting data that is being graphed. However, it is graphing using generic graphs and I would like it to graph in the same way that the check_tcp plugin graphs. I found that the check_tcp metric is configured in this file:
~/lib/python3/cmk/gui/plugins/metrics/translation.py
check_metrics["check_tcp"] = {
    "time": {"name": "response_time"},
}
The “response_time” configuration is reference in the following files:
~/lib/python3/cmk/gui/plugins/metrics/network.py
~/lib/python3/cmk/gui/plugins/metrics/perfometers.py
Upon investigation, I found a number of articles that indicated creating a custom file here with a custom check_metric that would utilize the current built in definitions for graphing:
~/local/share/check_mk/web/plugins/metrics
vi ~/local/share/check_mk/web/plugins/metrics/powershell.py
check_metrics["powershell.exe"] = {
    "time": {"name": "response_time"},
}
This did not work so I tried to add the following to get it to work based on what the above translation.py file had in it:
#!/usr/bin/env python3

from typing import Dict

from cmk.gui.plugins.metrics.utils import check_metrics, CheckMetricEntry, KB, m, MB

#  Custom metrics for powershell.exe checks

check_metrics["powershell.exe"] = {
    "time": {"name": "response_time"},
}
It still isn’t working. I was wondering what would be required to get this working for these checks? This also would include the “Service Perf-O-Meter”.
See attached images of current setup.
Thank you.
Check_tcp Graphing:
Powershell.exe Graphing:

