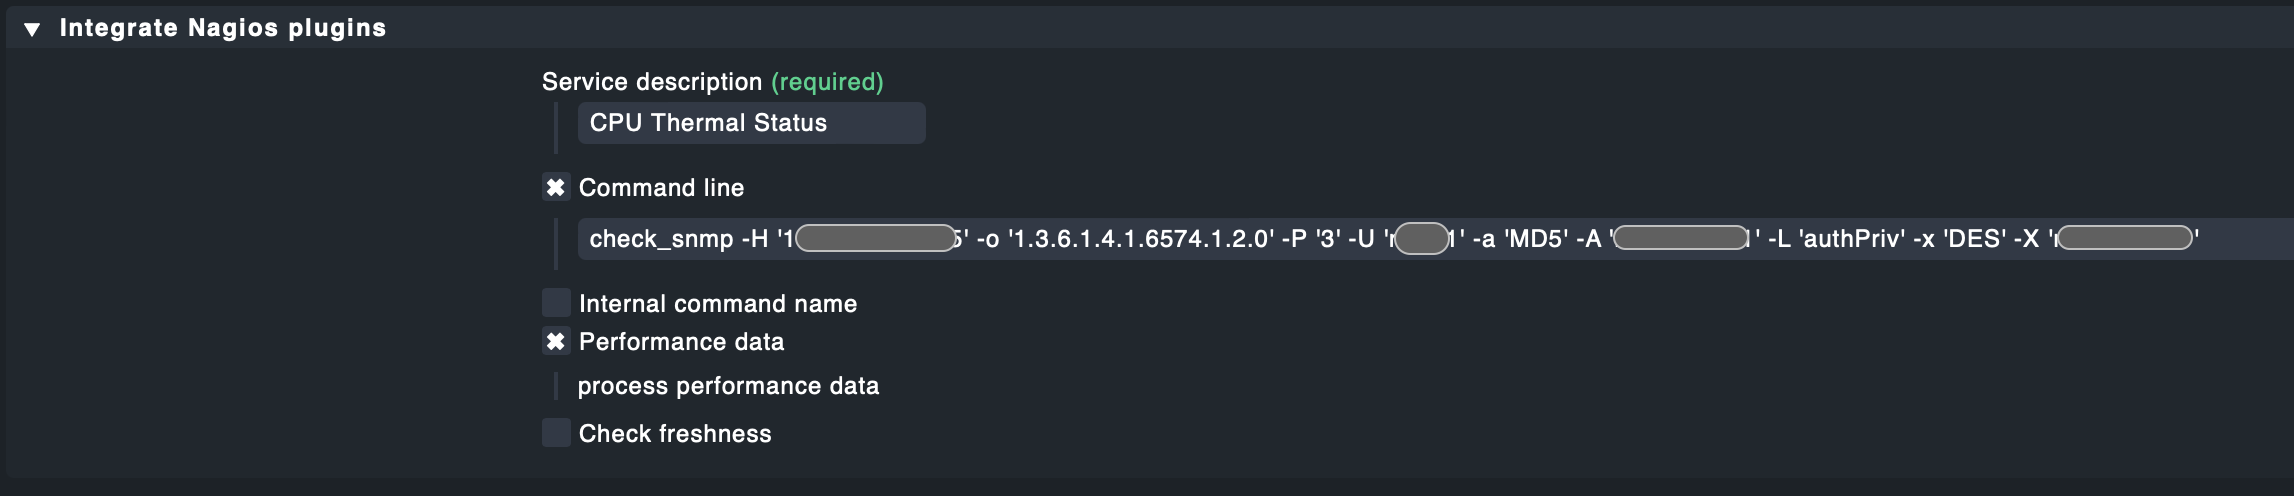
Synology OID 1.3.6.1.4.1.6574.1.2.0 is about system temperature, not CPU.
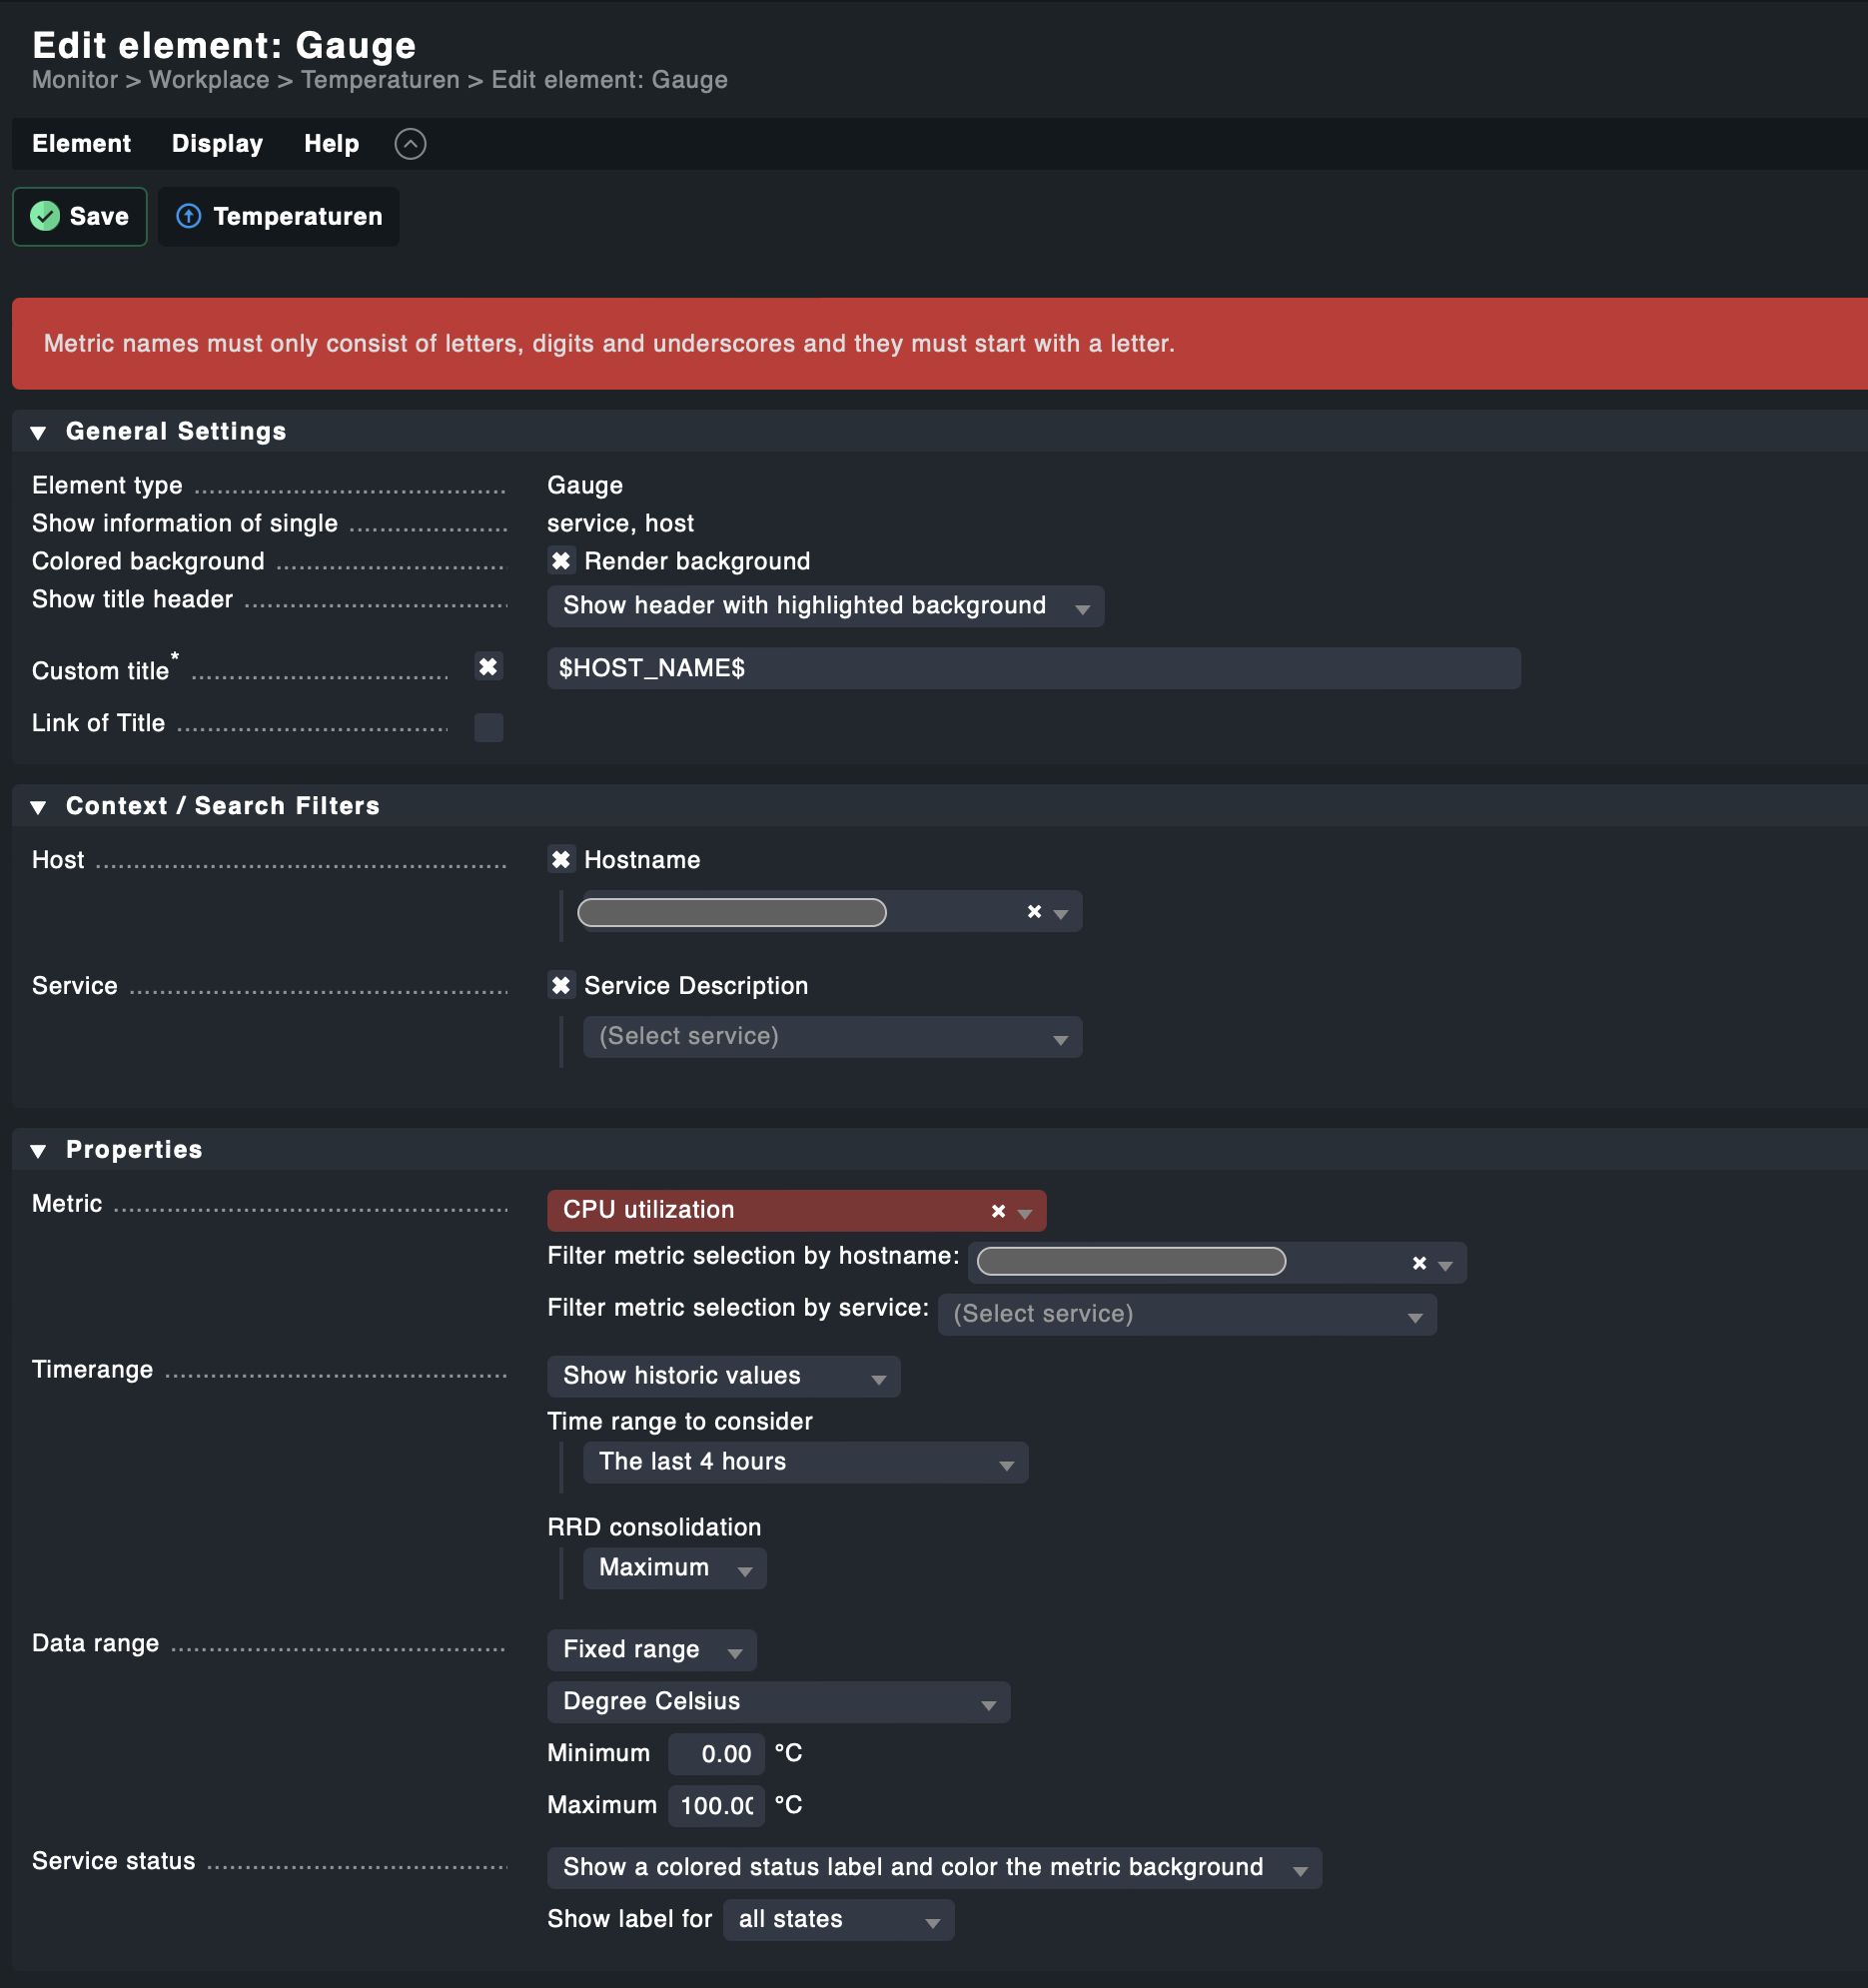
If you add -u °C -l Temperature to your check_snmp command line, your service output will have °C as units added and the graph will use Temperature as label for the graph metric instead of the OID Iso.1.3.6.1.4.1.6574.1.2.0. Hopefully the metric name error will be gone then.
Since I am using raw, I can’t make a gauge in a dashboard, so can’t test any further than this.
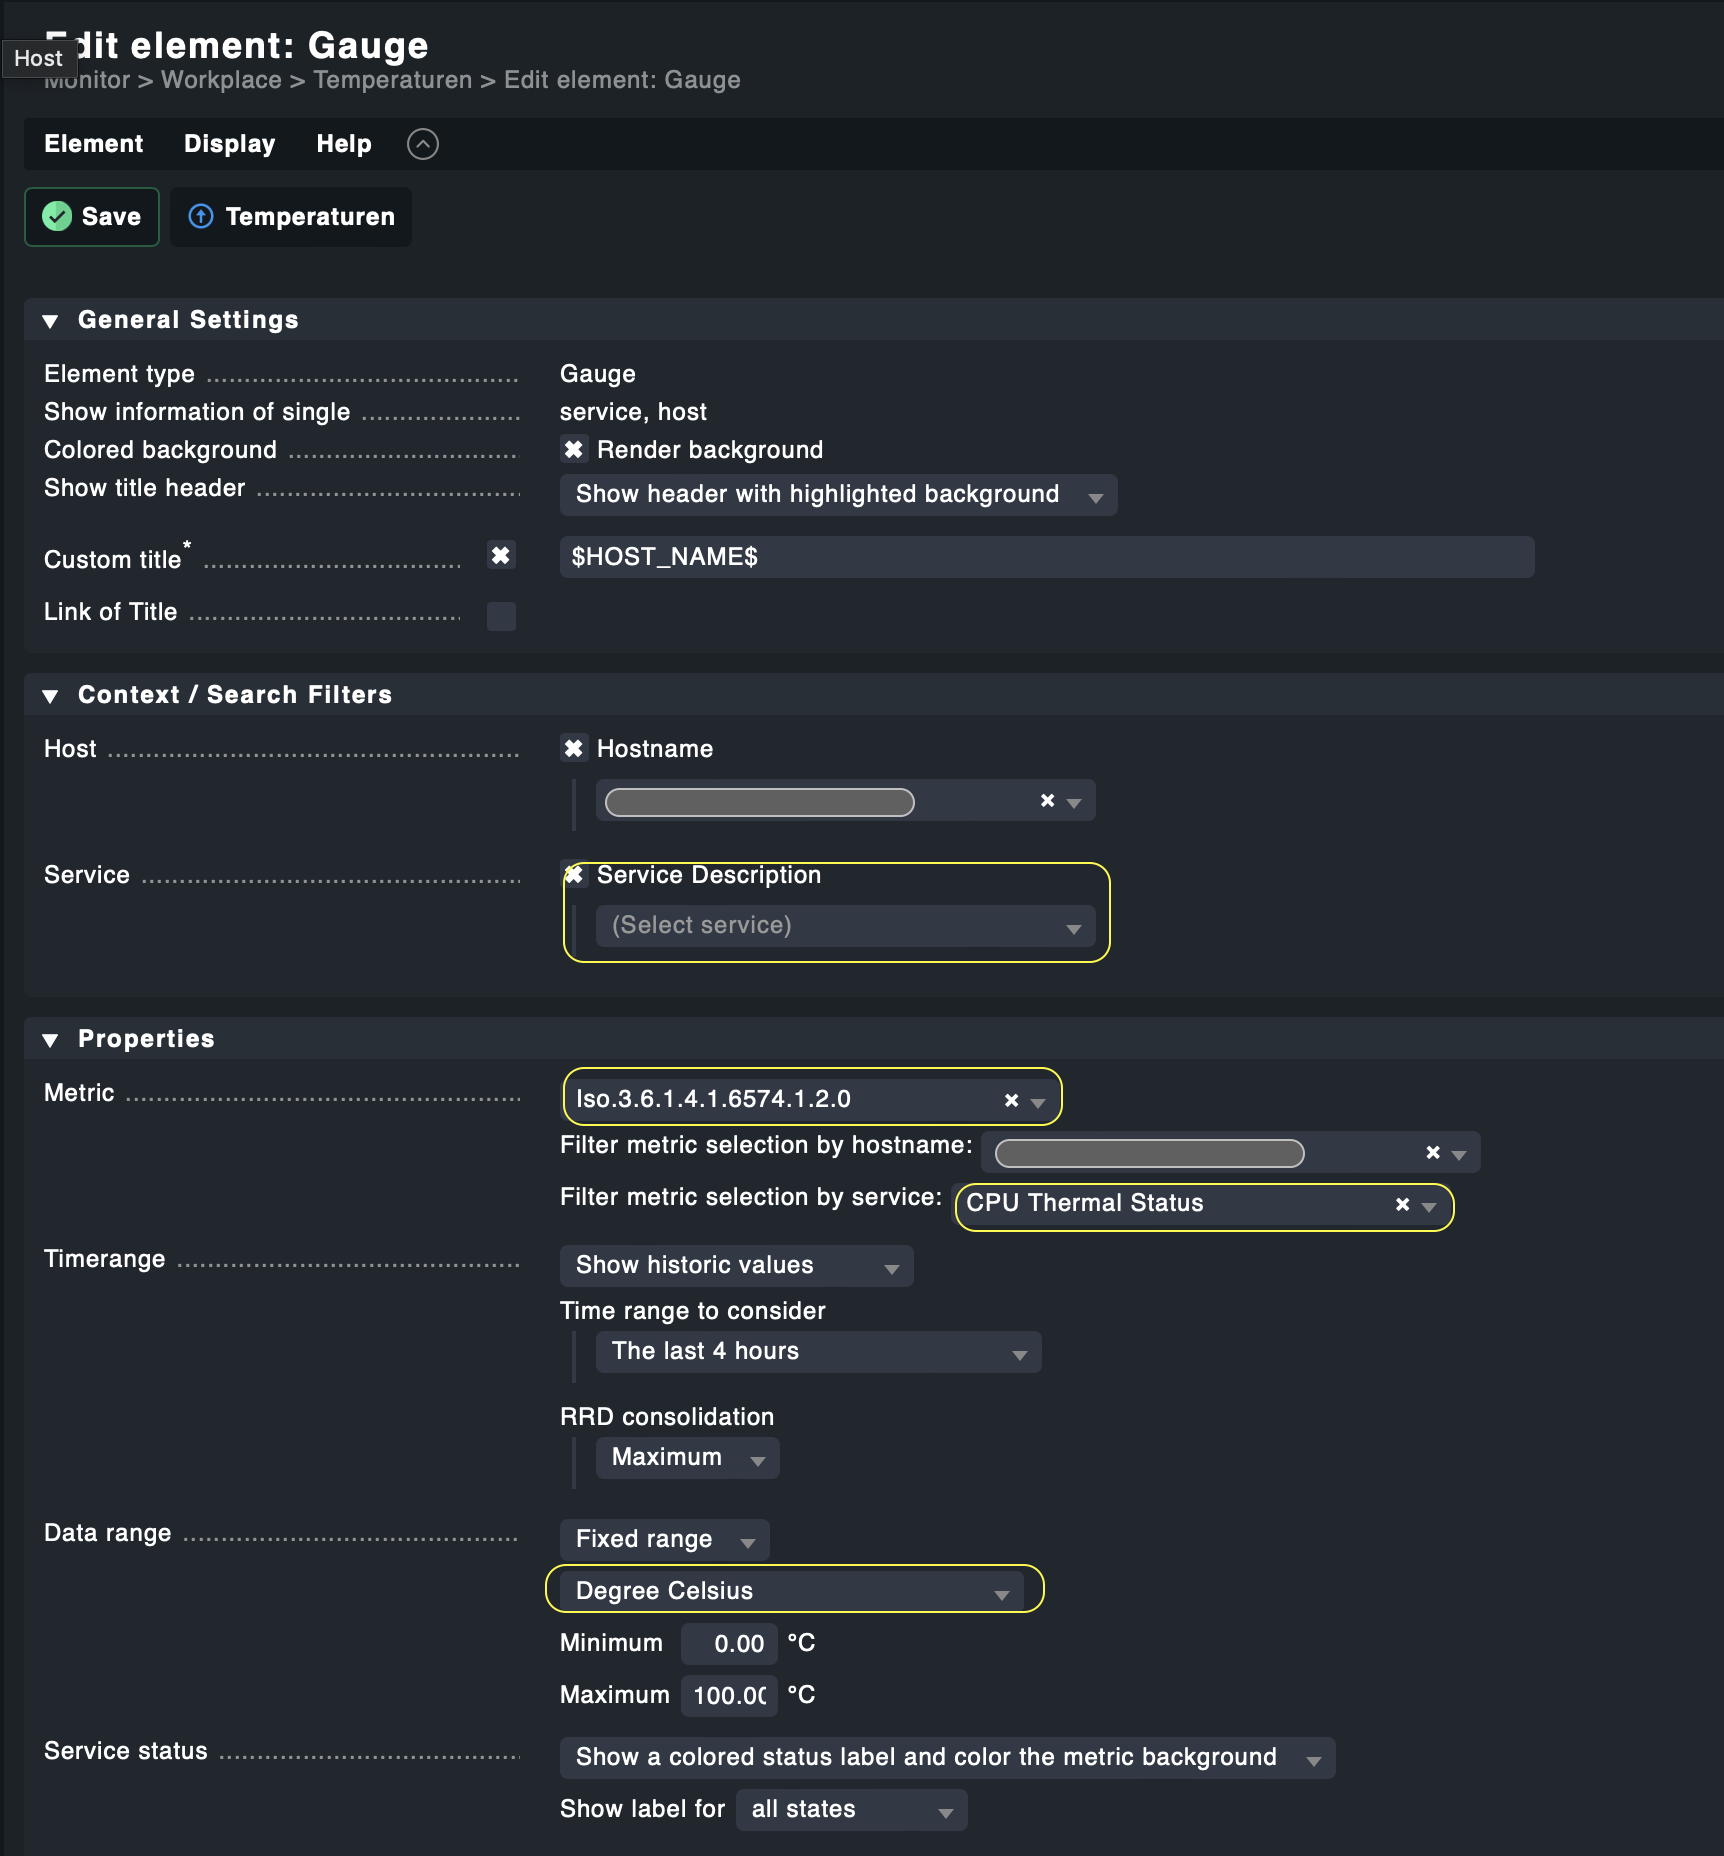
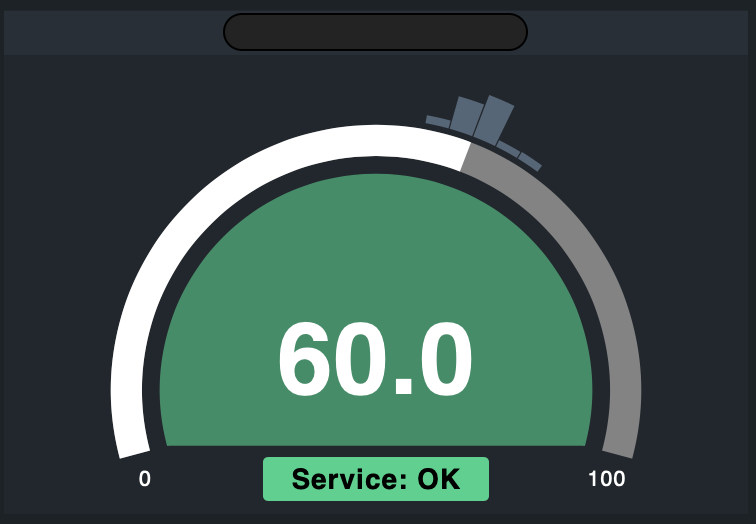
first I could not find the right Service Name with Service Description field, but next day it suddenly appeared (or my eyes gett’n old ) and - thanks to Yggy. - , now I got a perfect gauge.
This topic was automatically closed 365 days after the last reply. New replies are no longer allowed. Contact an admin if you think this should be re-opened.