Dashboard Graphs only Rendering if Browser Zoom was downsized

CMK version: Check_MK version 2.2.0b5 CRE
OS version: Debian GNU/Linux 11 (bullseye)

Hello folks,
I’ve got a really strange problem with dashboards and in particular with views on dashboards.

Like one can see in my uploaded screenshot there are some graphs missing in this viewport at the bottom:

Now if I shrink my browser zoom to like 67% then all missing graphs are appearing. To me this looks like a bug.

Does anyone have the same issue? There are 3 columns and 15 graphs to render.

Regards,
Duck

Quack Quack. Nobody the same issue? :face_with_open_eyes_and_hand_over_mouth:

Hi @TheIncredibleDuck,

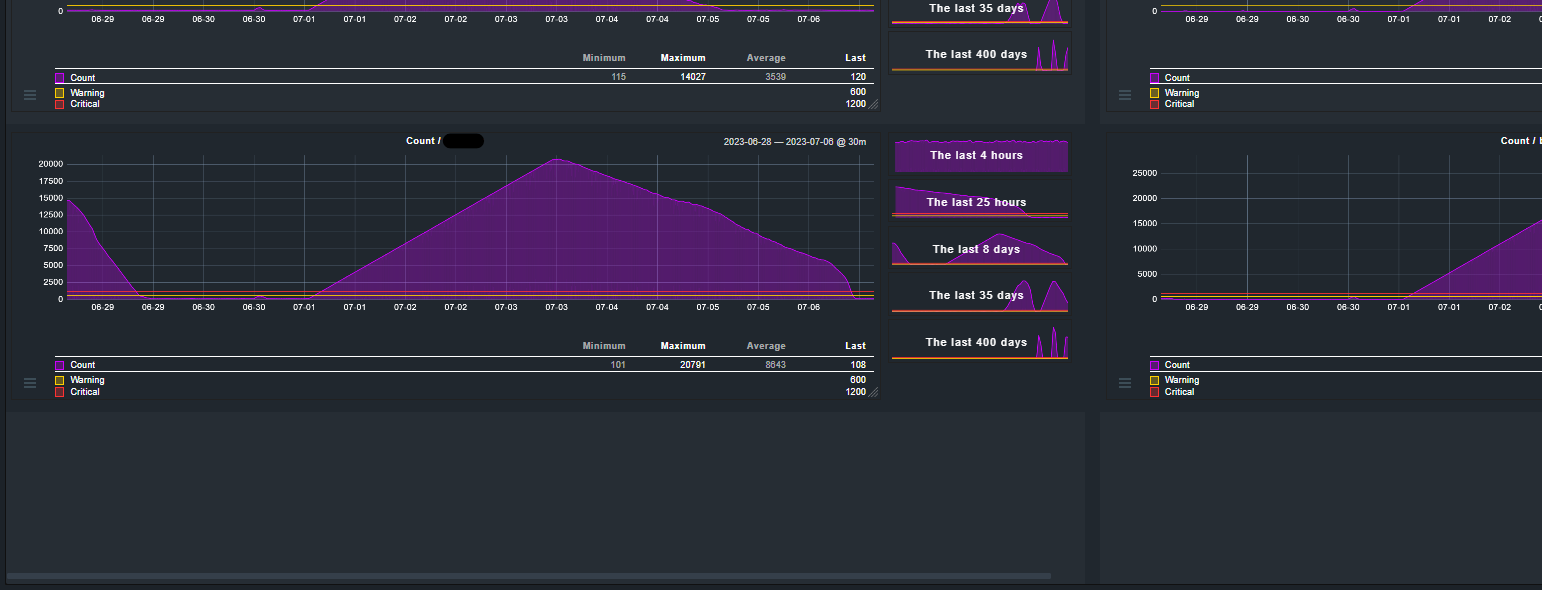
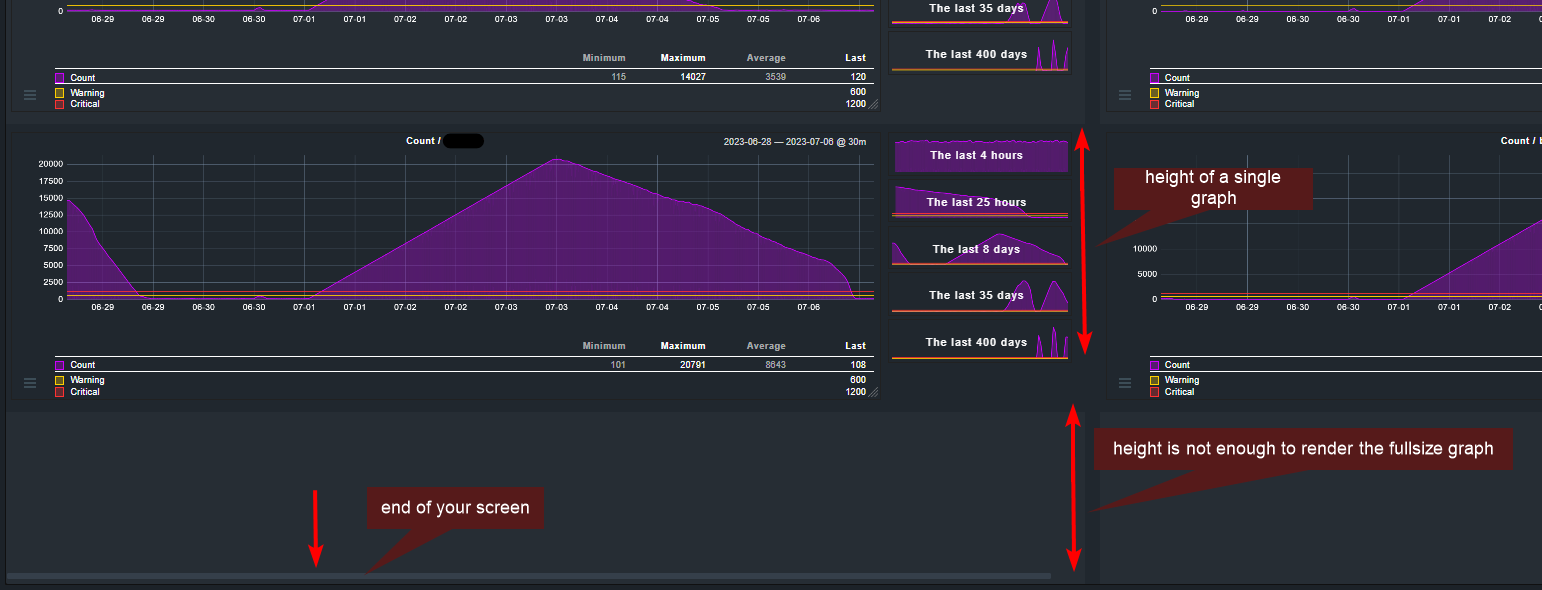
I never had this issue but I think it is because the graph that is not rendering cannot fit fully on your screen. As you can see in your screenshot there is the end of the browser window.

Try to reduce the height of your graphs and see if it still happens.

I’m not a 100% sure on this one but it makes sense i guess. :sweat_smile:

Regrads
Norm

Hey Norm,

thanks for your reply. But in the settings of this “view” there are no height parameters to change this behaviour. I remember that I tried to avoid this without a “view” with all graphs at its own, but the problem was the same.

I wonder why the dashboard isn’t scaling all the graphs in its view. Really strange.

Regards,
Duck

Hey @Norm do you think I should open a bug report?

Regards,
Duck

I recently noticed this when graphs are Iframes and display resolution is low. I will file a bug ticket internally for this, but still would recommend using dashboard elements that are not contained in Iframes.

1 Like

This topic was automatically closed 365 days after the last reply. New replies are no longer allowed. Contact an admin if you think this should be re-opened.